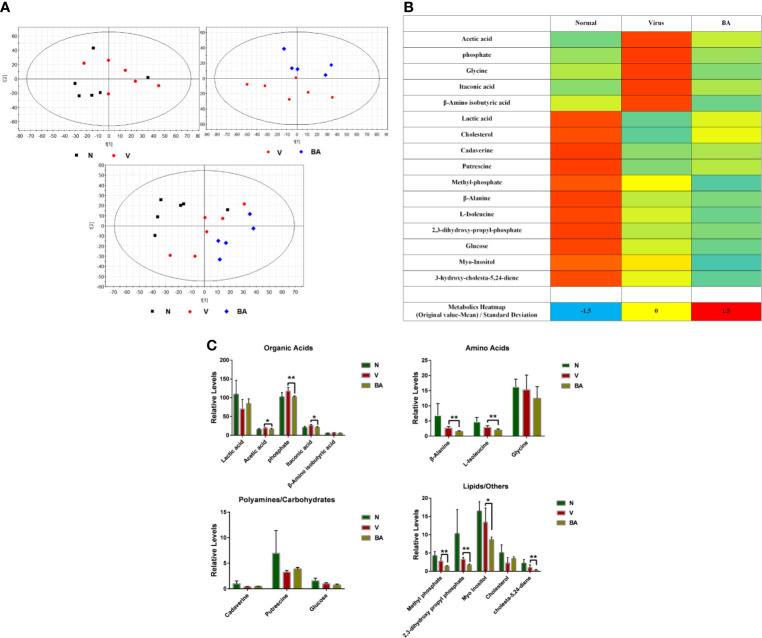
Figure 4.
Metabolomics analysis. At 48 h postinfection, cell samples were harvested for metabolomic analysis. (A) Partial least squares discriminant analysis (PLS-DA) was used to identify the obtained 1977 metabolite markers from GC-MS (N: healthy cells; V: virus-infected cells; BA: the infected cells treated by BA). (B) Metabolic heat map. For each metabolite, data was normalized using the z-score ((original value-mean) standard deviation) to values between -2 (dark blue), 0 (median; white), and 2 (maximum, dark red), to make a metabolite heat map. (C) Comparative analysis of major metabolites. The 16 metabolites were grouped as organic acids, amino acids, polyamines/carbohydrates, lipids/others. Data are presented as mean ± SD. *p ≤ 0.05, **p ≤ 0.01 compared with virus samples.

