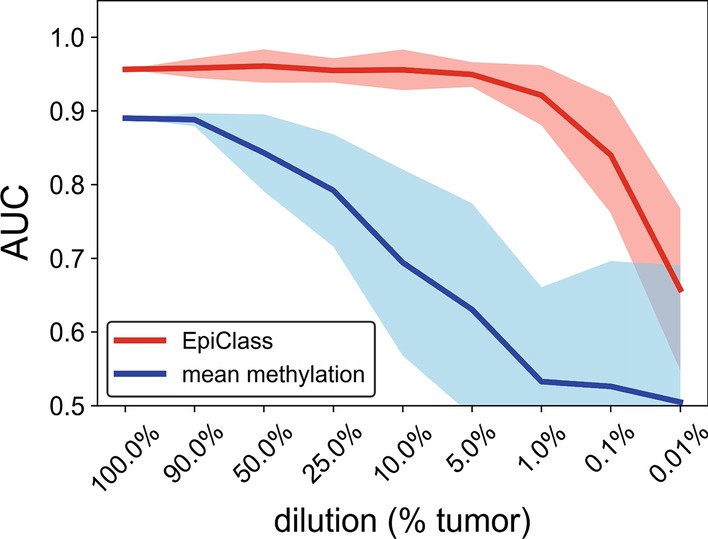
Fig. 2.

Simulated performance of EpiClass as a function of admixture ratios of epithelial ovarian carcinoma (EOC) to WBC RRBS reads. The performance of the methylation density binary classifier (EpiClass, red) and mean locus methylation classifier (blue) at increasing dilutions of EOC RRBS reads in a background of WBC RRBS reads acquired from Widschwendter et al.[8]. Simulated performance of improved classification over mean methylation at different read depths demonstrated in Additional file 1: Figure S4 and S5. AUC area under the curve, EpiClass methylation density classifier
