Fig. 3.
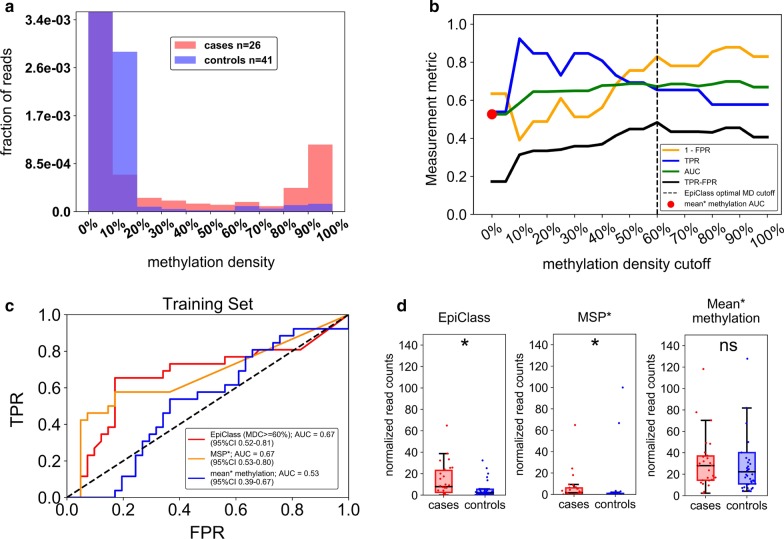
Performance of EpiClass in EOC patient and control plasma samples. a The pooled epiallelic fractions of cfDNA methylated epialleles with varying methylation densities in EOC (red, n = 26) and healthy (blue, n = 41) patient plasma samples. Purple-shaded regions indicate overlap between the two plasma sets. b Performance of EpiClass at each methylation density cutoff for the EOC and healthy control plasma samples. Dotted line shows the optimal methylation density cutoff derived from EpiClass. The red dot indicates the ROC curve AUC for the mean methylation cutoff. Measurement metric refers to either 1—FPR, TPR, AUC, or TPR–FPR. c ROC curves showing the classification performance of using the optimal methylation density cutoff determined by EpiClass (red), MSP (orange), or mean methylation cutoff (blue) to identify the EOC and healthy control plasma samples. d Boxplots showing the performance of the epiallelic fraction cutoffs for either the optimal 60% methylation density cutoff determined by EpiClass, MSP, or mean methylation to classify plasma samples from EOC patients (red, n = 26) or healthy controls (blue, n = 41) Y-axes adjusted to ignore healthy control outliers. EOC epithelial ovarian carcinoma, EpiClass methylation density classifier, MDC methylation density cutoff, AUC area under the curve; * indicates p < 0.05, two-sided Wilcoxon rank-sum test; ns = not significant; Mean* methylation was inferred from the fraction of all methylated epialleles. MSP* performance estimated using an MDC of 95%. Supplementary Figure S9 demonstrates no statistical difference between sample cohorts with respect to mean methylation

