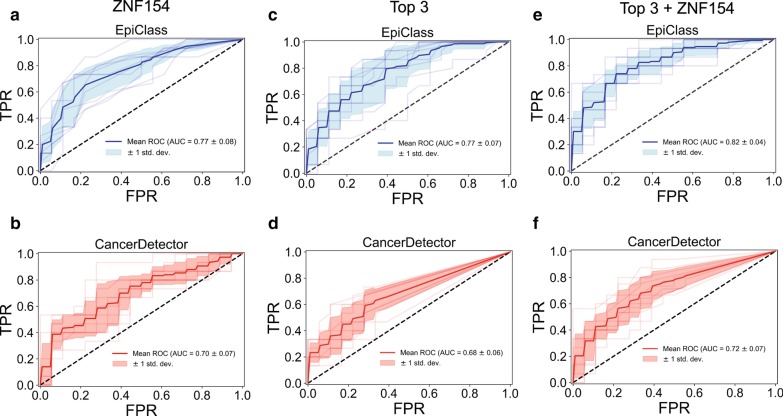
Fig. 6.
Comparison of EpiClass and CancerDetector. a, b Receiver operating characteristic curves (ROCs) based on classification of 10 test sample sets using either the optimal methylation density read counts at the ZNF154 marker region for EpiClass (a, blue), or the estimated sample tumor fraction derived by CancerDetector (b, red) using reads at the ZNF154 marker region. Light shaded lines indicate individual ROC curves for each test sample set. Dark line indicates the mean ROC curve. Light shaded region indicates 1 standard deviation from the mean. c, d Same as A–B except for the chosen top 3 liver cancer markers. e, f Same as C–D except for the top 3 liver cancer marker regions and ZNF154 marker region. AUC area under the curve, std. dev. standard deviation

