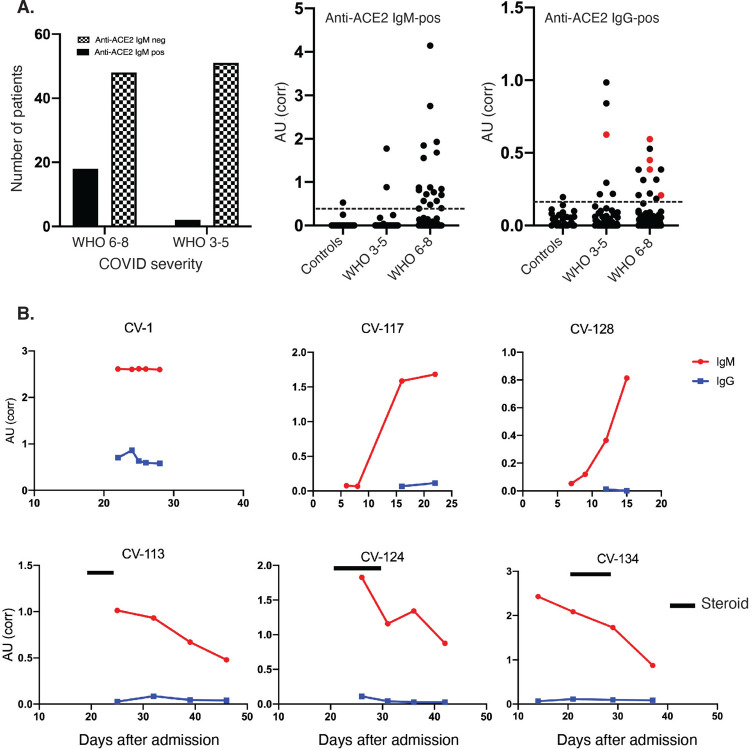
Figure 1: Anti-ACE2 IgM antibodies are found in patients with COVID-19.
A: Antibodies were assayed by ELISA in the combined COVID cohort (N = 118 patients). Left panel: the number of patients with and without anti-ACE2 IgM antibodies is shown grouped by disease severity. 27.2% of severe patients were anti-ACE2 positive compared to 3.8% with moderate COVID (p = 0.0009; Fisher’s exact test). In the center and right panels, data from anti-ACE2 IgM and IgG ELISA assays, respectively, is presented as corrected OD 450 absorbance units. This data was obtained on all the COVID patients presented in the left panel, as well as from 30 healthy controls. Red dots in the IgG panel denote IgG-positive samples that also have anti-ACE2 IgM antibodies. The horizontal line on each plot represents the cutoff for assigning a positive antibody status. B: Longitudinal analysis of anti-ACE2 IgM antibodies. For all those anti-ACE2 IgM-positive patients with multiple banked sera available (16/18), anti-ACE2 IgM and IgG antibodies were quantitated over time. Red and blue lines on each plot denote anti-ACE2 IgM and IgG antibodies, respectively. Solid black bars represent steroid treatment periods. Additional examples are shown in Suppl Fig 3.

