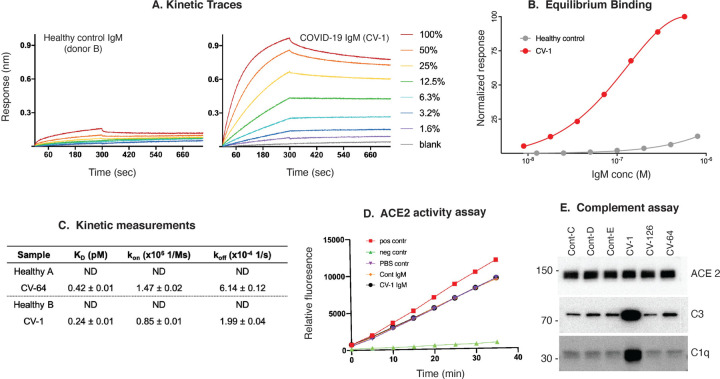
Figure 3: Properties of anti-ACE2 IgM antibodies. (A–C): Kinetic analysis.
A: Kinetic traces of the binding interactions between immobilized human ACE2 and purified IgM, as determined by biolayer interferometry. Percentages represent twofold dilutions of IgM from patient CV-1 and Control B. B: Equilibrium binding titrations. Normalized responses at the indicated concentrations of purified IgM from the donors shown in (A) are plotted. C: Quantitation of the data obtained in A&B, and a separate patient and control shown in Supp. Fig 5A&B. D: Anti-ACE2 IgM antibodies do not inhibit ACE2 activity. ACE2 activity, in the presence or absence of IgM from patient CV-1 or Control B, was measured using a fluorescent substrate in a time course assay. The positive control was ACE2 alone, and the negative control was ACE2 plus ACE2 inhibitor (see Suppl Fig.5D for data obtained from another patient and control). E: Complement activation induced by IgM antibodies to ACE2. Dynabeads containing immune complexes of ACE2 and purified IgM from controls or anti-ACE2-positive COVID-19 (CV) patients were incubated with human complement. Deposition of C1q and C3 was visualized by immunoblotting. ACE2 is shown as a loading control. Markedly enhanced C1q binding in CV-1 observed in 3 separate experiments.

