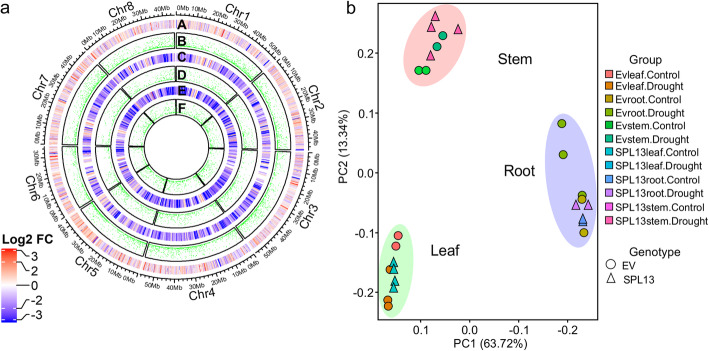
Fig. 1.
Principal Component Analysis (PCA) depicted tissue-dependent expression patterns. Circos plot (a) visualization of transcript fold changes and their significance levels in different tissues of alfalfa plants in response to drought stress. (A) Heat map of leaf-derived log2 transcript fold changes, (B) p_values of the DEG in leaf tissues, (C) Heat map of stem-derived log2 transcript fold changes, (D) p_values of the DEG in stem tissues, (E) Heat map of root-derived log2 transcript fold changes, (F) p_values of the DEG in root tissues. b PCA plots are constructed using total exon read counts from ‘.bam’ extension RNA sequenced samples irrespective of genotype and tissue. Transcript level comparisons in ‘a’ were between leaf, stem, and root tissues of drought-stressed SPL13RNAi and EV alfalfa plants. Red and blue colours from the heat map in ‘a’ represent an increased and decreased transcript log2 fold-changes, respectively. P_values are represented with green colours. Circlize (V 0.4.11), an R-software package was used for data visualization [19]. n = 3 biological replicates

