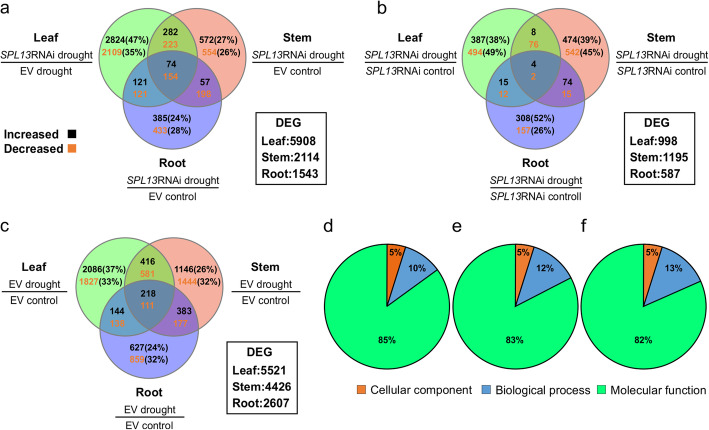
Fig. 2.
Tissue and genotype-specific expression patterns in genotypes of SPL13RNAi and EV alfalfa plants in response to drought. a Differentially expressed genes between drought stressed SPL13RNAi and EV plants; b SPL13RNAi-specific gene expression plasticity in response to drought stress; c EV-specific gene expression plasticity in response to drought stress; Gene Ontology (GO-term) –based percent representation of DEGs in cellular components, biological process, and molecular functions between SPL13RNAi and EV in d leaf, e Stem, and f Root tissues. The increased and decreased DEG percent provided in ‘a’, ‘b’, and ‘c’ vendiagramm were calculated from the total DEG of the specific tissue comparison. Upper and bottom values in ‘a’, ‘b’, and ‘c’ vendiagramm represent the number of significantly increased and decreased genes, respectively

