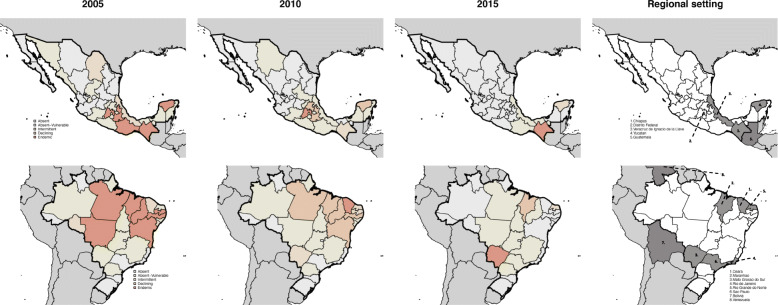
Fig. 3.
Putative classification of states in Mexico and Brazil in 2005, 2010 and 2015 (left to right). Major administrative units (states) are shaded (colour) by their epidemiological classifications. Country and state boundaries (shapefiles) were obtained from gadm.org using the getData function from the raster package in R. Grey shading shows human population density downloaded from worldpop.org and aggregated to 0.25 × 0.25 degrees per cell. The fourth panel in each row indicates epidemiologically notable states and countries frequently referred to in the main text. Note that Distrito Federal refers to Mexico City. All maps in Fig. 3 are created by the authors

