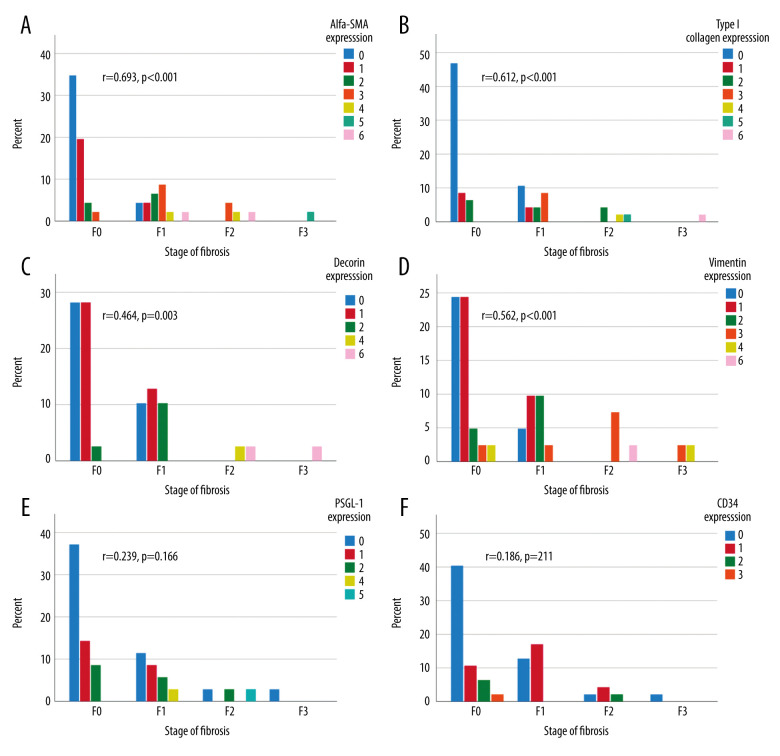
Figure 3.
Combined (portal, lobular, and central) biomarker expression scores (columns) in different stages of fibrosis according to Metavir at the first follow-up (X-axis). The Y-axis presents the percentage of all patients. Correlation between immunohistochemistry grades and stage of fibrosis calculated with Spearman’s correlation, 2-tailed p-value. α-SMA expression (A), type I collagen (B), vimentin expression (C), decorin expression (D), PSGL-1 expression (E), and CD34 expression (F).

