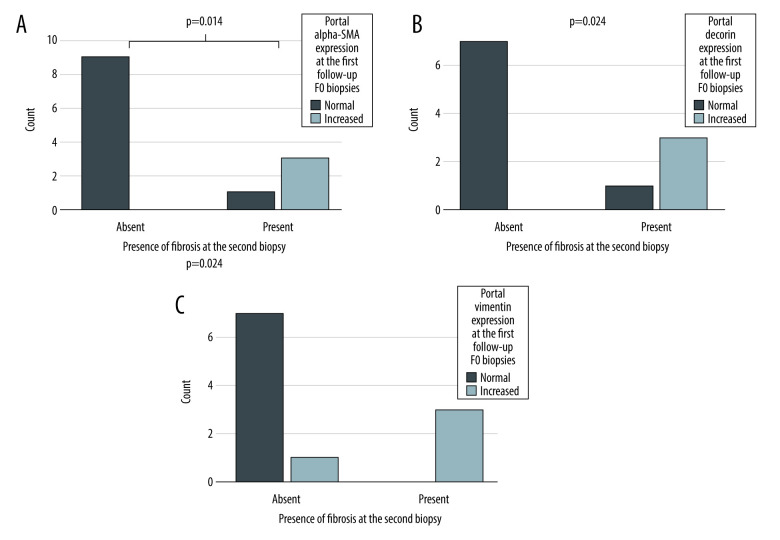
Figure 4.
The expression portal α-SMA (A), decorin (B), and vimentin (C) in F0 biopsies at the first follow-up. X-axis presents the patients who still had no fibrosis (Absent) and who developed fibrosis (Present) during the follow-up (X-axis). The Y-axis presents the number of patients. P-value for the significance for dependency between portal α-SMA, decorin and vimentin expression at the first follow-up and presence fibrosis in the second follow-up biopsy calculated Fisher’s exact test.

