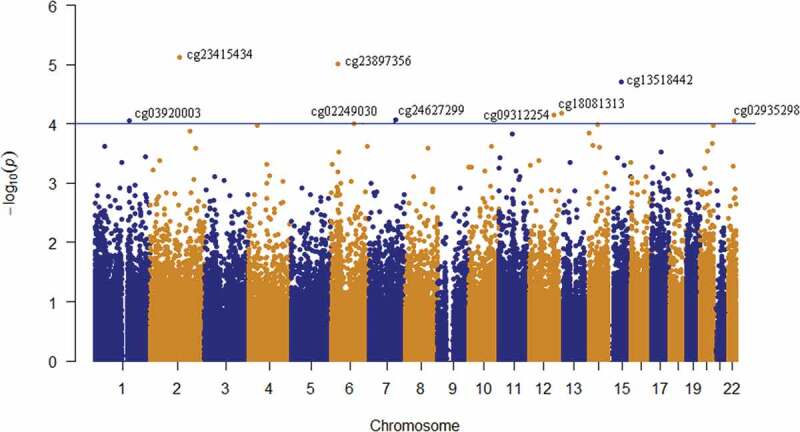
Figure 2.

Manhattan plot of the longitudinal epigenome-wide association of depressive-transformed variable in whole-blood samples of 59 adolescents. The depressive-transformed variable was calculated based on depression DAWBA band risk scores and MADRS-S scores. The blue line represents the significance level at p = 10−4.
