
Figure 5.
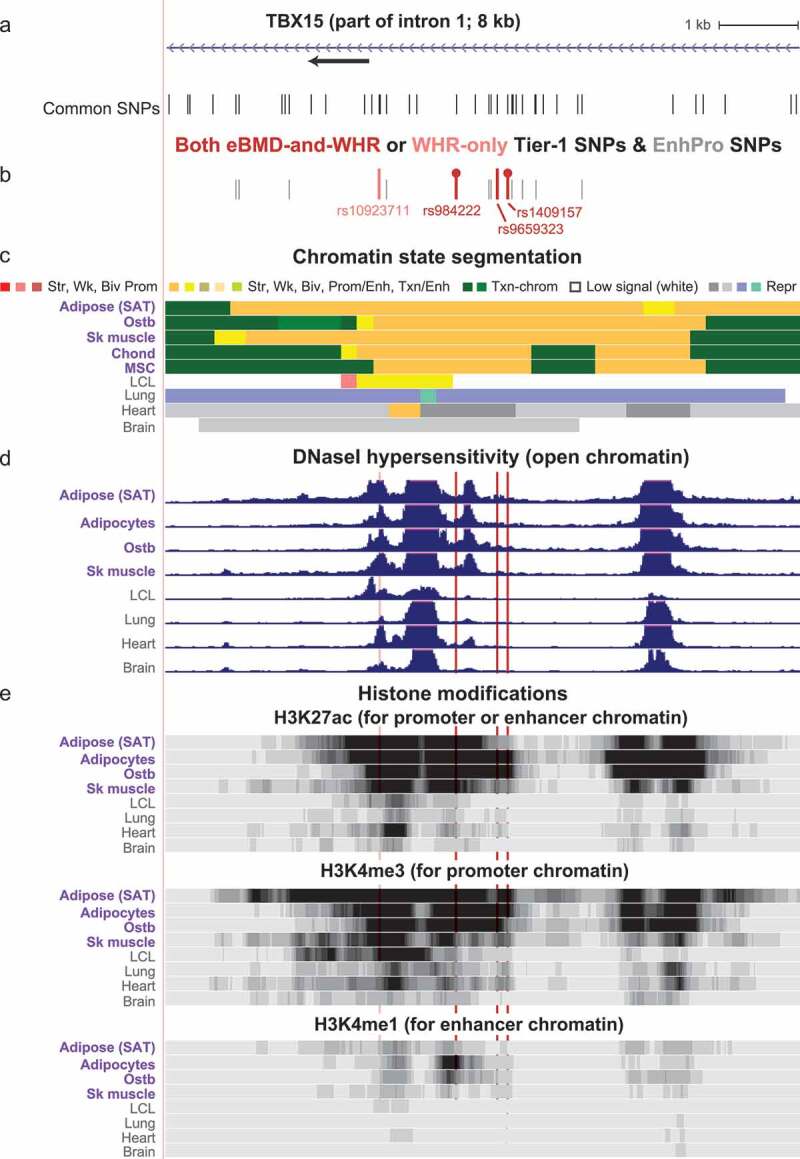
Zoomed in view of four Tier-1 SNPs in the middle of TBX15 intron 1. (a) The common SNPs in this subregion of intron 1 of TBX15 (chr1:119,500,183–119,508,182). (b-e) EnhPro SNPs and the subset of EnhPro SNPs that are designated Tier-1 SNPs, chromatin state segmentation, DNaseI hypersensitivity, and histone modifications as in Figure 4 except that the CpG island track is not shown due to there being no CpG islands in this region. In panel B, lollipops denote the two TBX15 eQTLs for SAT.