
Figure 6.
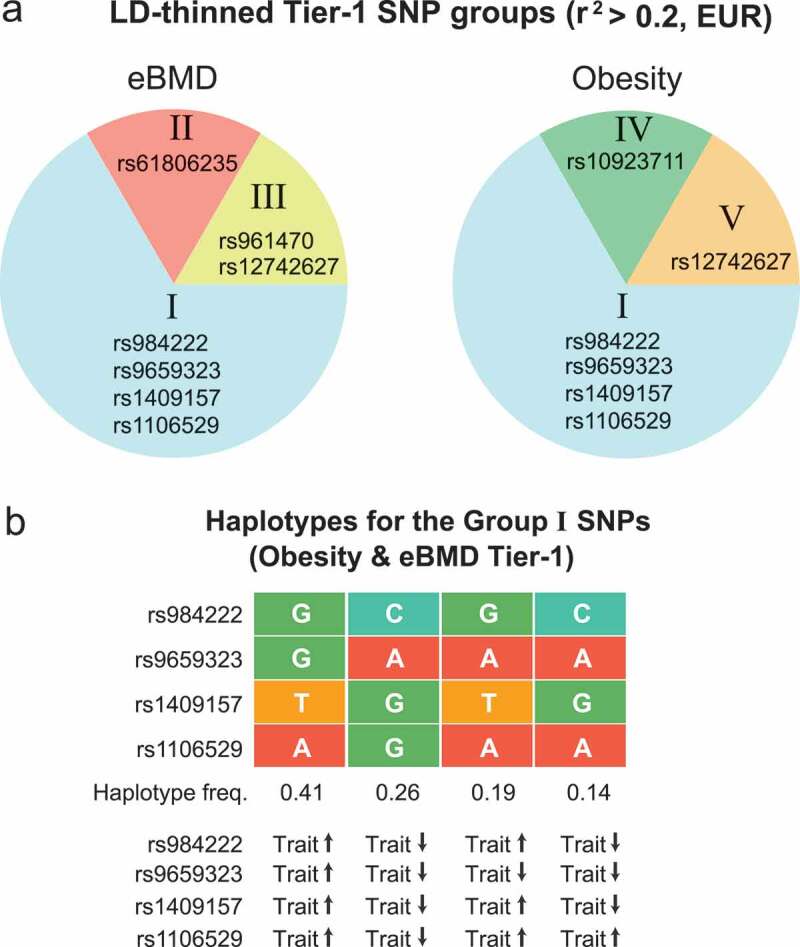
The genetic architecture of the Tier-1 SNPs at TBX15 suggests that there are multiple causal regulatory SNPs for obesity risk and for osteoporosis risk. (a) The SNPclip program at LDlink [53] was used to trim the Tier-1 SNPs into groups with r2 > 0.2 (EUR); the SNP members of the resulting groups are shown in pie charts. (b) The haplotypes for trimmed Group I are shown with designations of trait-increasing (trait ↑) or trait-decreasing (trait ↓) alleles; the trait-increasing alleles from obesity GWAS are the risk alleles but for eBMD GWAS they are the non-risk alleles because of the osteoporosis-protective effects of high BMD.