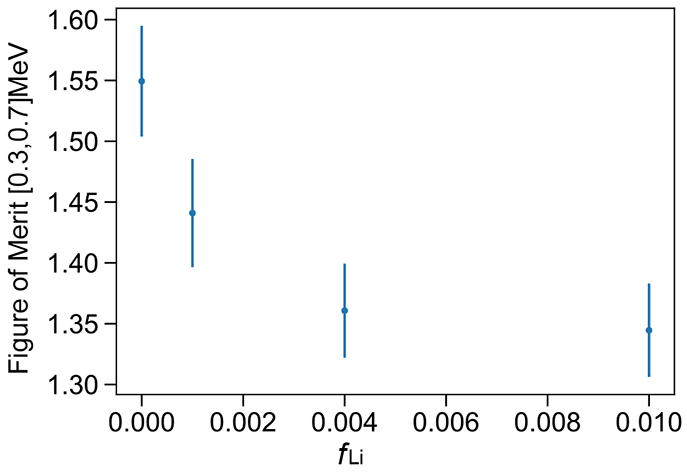
Figure 10:

FOM (peak separation divided by the sum of the peak FWHM) in the approximate region of the neutron capture peak as a function of loading. As expected the trend closely follows the absolute light yield shown in Figure 4. The values and error bars are determined through a double-Gaussian fit of the distributions.
