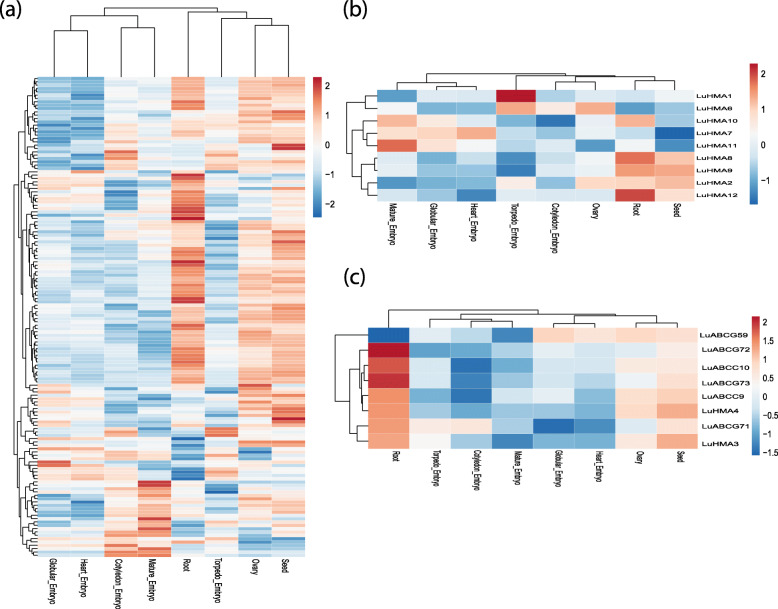
Fig. 4.
Expression profiling of the 160 differentially expressed genes in eight different tissues based on log fold-changes, including 143 LuABC genes (a), nine LuHMA genes (b), and eight potential Cd candidate genes (c). The red represents up-regulated genes and blue is for down-regulated ones. The remaining 48 LuABC and one each HMA (LuHMA5) and Cd (LuABCG58) genes were discarded because they were represented by less than 5 RPM (reads per million) after normalization of the data. Expression in anther tissue was used as a reference for expression analysis

