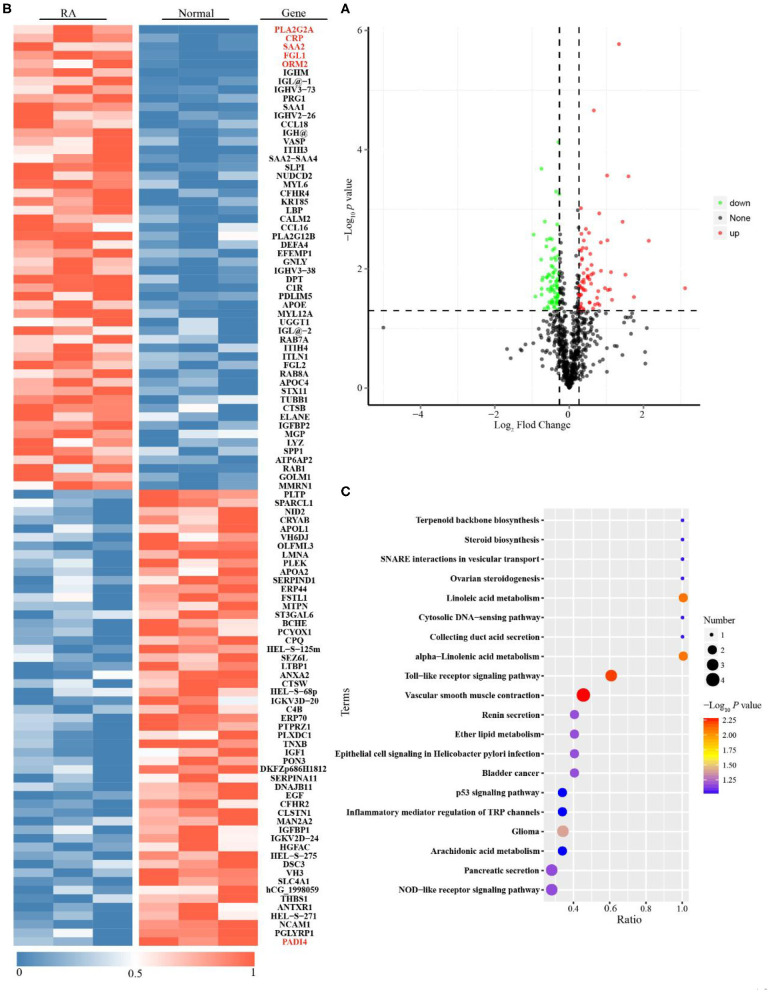
Figure 2.
Proteomics analysis for Rheumatoid arthritis (RA) patients with moderate to high disease activity vs. healthy subjects. (A) Single volcano plots of the comparison of moderate to high active RA vs. healthy subjects (68 increased proteins are shown in volcano plots described in red color; 74 decreased proteins are displayed in volcano plots described in green color). (B) Heatmap of 142 differentially expressed proteins for the comparison of moderate to high active RA vs. healthy subjects. (C) KEGG enrichment analysis for differentially expressed proteins (The ratio means the protein numbers of significant differentially expressed proteins which located pathway entry divided into the total protein numbers of all annotated proteins which located pathway entry. When the ratio is greater, it means the degree of enrichment is higher. P-value was determined by hypergeometric test. When the p-value is closer to zero, the enrichment is more remarkable).

