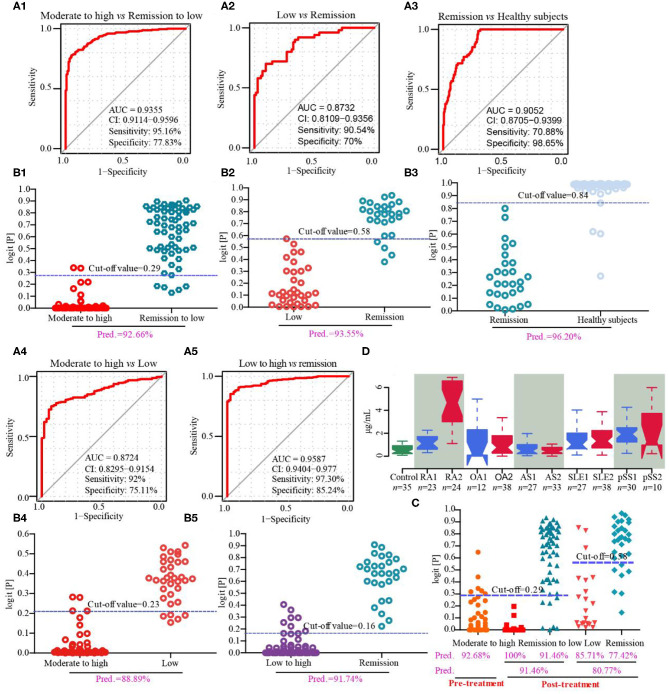
Figure 3.
Discovery and validation of fibrinogen-like protein 1 (FGL1) as a novel biomarker from cohorts 3–5. (A1,B1), respectively mean the receiver operating characteristic (ROC) curve in the discovery set and predictive value in the validation set of RA with moderate to high vs. remission to low disease activity from cohort 3; (A2,B2) mean the ROC curve in the discovery set and predictive value in the validation set, respectively, of RA with low disease activity vs. RA in remission from cohort 3; (A3,B3), respectively mean the ROC curve in the discovery set and predictive value in the validation set of RA in remission vs. healthy subjects from cohort 3; (A4,B4) mean the ROC curve in the discovery set and predictive value in the validation phase, respectively, of moderate to high active RA vs. low active RA from cohort 3; (A5,B5), respectively, mean the ROC curve in the discovery set and predictive value in the validation phase of low to high active RA vs. RA in remission from cohort 3. (C) represents the predictive values in drug intervention from cohort 4. (D) describes serum concentrations of FGL1 in healthy subjects (control), RA in remission (RA1), active RA (RA2), osteoarthritis with Kellgren-Lawrence grade II (OA1), osteoarthritis with Kellgren-Lawrence grade III (OA2), stable ankylosing spondylitis (AS1), active ankylosing spondylitis (AS2), inactive systemic lupus erythematosus (SLE1), active systemic lupus erythematosus (SLE2), stable primary Sjogren's syndrome to primary Sjogren's syndrome with low disease activity (pSS1) and primary Sjogren's syndrome with moderate to high disease activity (pSS2). There are no significant differences among control, OA1 and OA2 and among control, AS1 and AS2. It shows no significance in SLE1 vs. SLE2 and pSS vs. pSS2, but significance with control. It displays significance among control, RA1 and RA2. The statistical significance of difference is calculated using a Kruskal-Wallis test.

