
Fig 5.
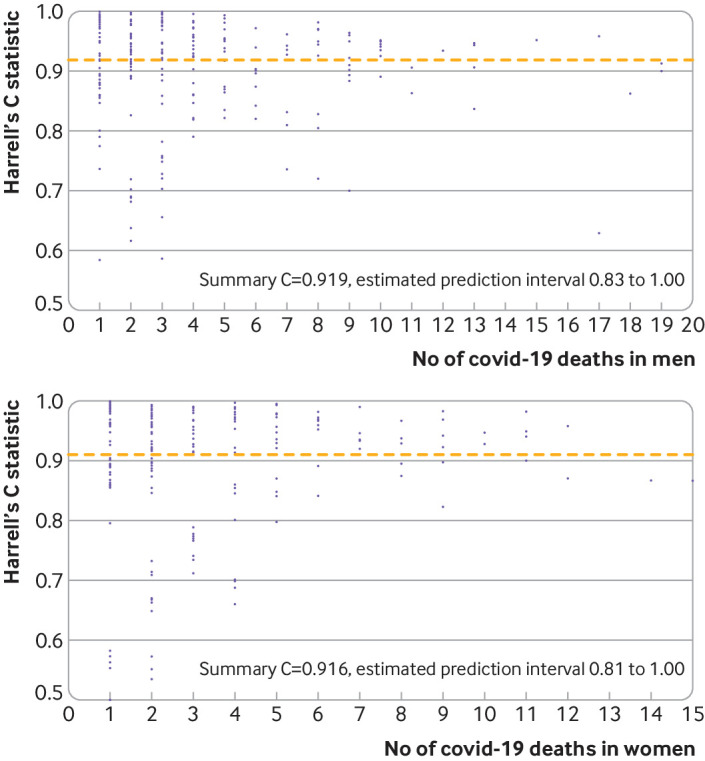
Funnel plots of discrimination using Harrell’s C statistic for each general practice in validation cohort versus number of deaths in each practice in men (top panel) and women (bottom panel) in first validation period
Official websites use .gov
A
.gov website belongs to an official
government organization in the United States.
Secure .gov websites use HTTPS
A lock (
) or https:// means you've safely
connected to the .gov website. Share sensitive
information only on official, secure websites.
Funnel plots of discrimination using Harrell’s C statistic for each general practice in validation cohort versus number of deaths in each practice in men (top panel) and women (bottom panel) in first validation period