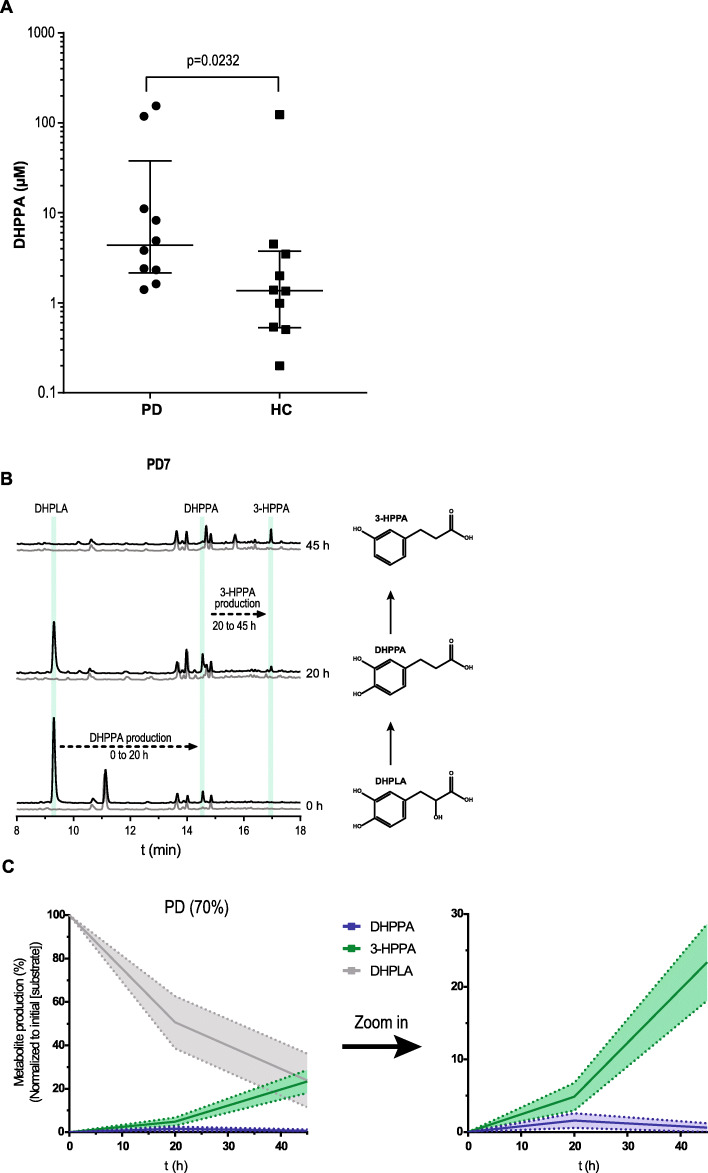
Fig. 4.
Higher DHPPA levels in PD patients and active levodopa deamination pathway in PD fecal suspensions. a DHPPA was extracted from fecal samples of PD patients (n = 10) and age-matched healthy controls (n = 10) using activated alumina beads, and concentrations were quantified using a standard curve of DHPPA on the HPLC-ED with 3,4-dihydroxybenzylamine as internal standard. DHPPA concentrations are depicted on the logarithmic y-axis, and individual levels are indicated and compared between Parkinson’s disease (PD) patients and age-matched healthy controls (HC). The cross-header represents the median (PD, 4.36 μM; HC, 1.37 μM) and the interquartile range (PD, 2.15–37.90 μM; HC, 0.53–3.75 μM). Significance was tested using an unpaired nonparametric Mann-Whitney test (p = 0.0232). b A representative HPLC-ED chromatogram of fecal suspension from PD7 where DHPPA is produced from DHPLA (black) after 20 h and is further metabolized to 3-HPPA after 45 h of incubation. The control, without the addition of DHPLA, is indicated in gray. The green bars indicate the retention time of the standards indicated. c Metabolite profiles of the PD fecal suspensions that produced DHPPA/3-HPPA within 20–45 h (70%) are merged as replicates. Lines represent the mean and the shadings the SEM; a zoom in graph of DHPPA and 3-HPPA is depicted on the right

