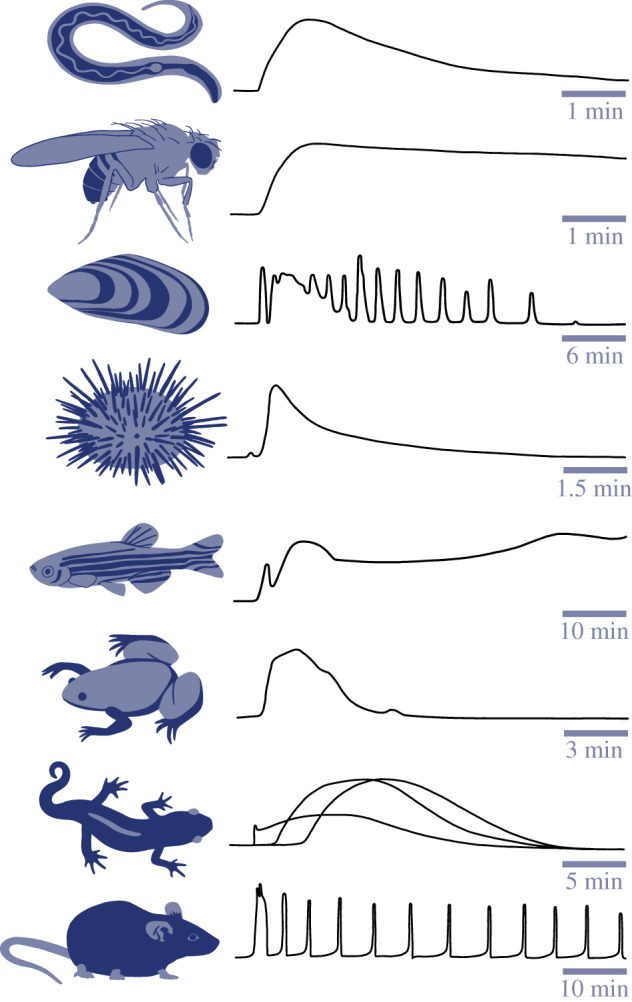
Figure 2.

Diagrams of typical cytoplasmic Ca2+ changes at fertilization across various species. From top to bottom: nematode (Caenorhabditis elegans) [62], fruit fly (Drosophila melanogaster) [63], purple mussel (Septifer virgatus) [7], sea urchin (Paracentrotus lividus) [64], zebrafish (Danio rerio) [65], frog (Xenopus laevis) [66], newt (Cynops pyrrhogaster) [67] and mouse (Mus musculus) [68]. Time indicated on scale bar for each Ca2+ trace. The three lines on the newt trace represent spatially distinct signals induced by different sperm during physiological polyspermy. Traces adapted from indicated references.
