Fig. 1.
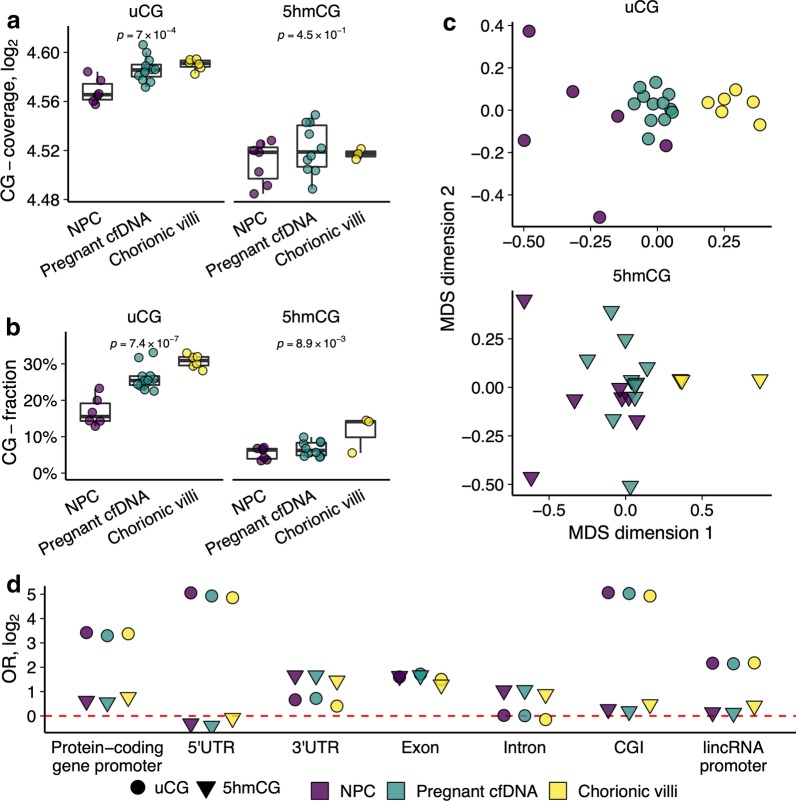
uTOP-seq and hmTOP-seq analysis of CV and cfDNA samples reveals a contribution of CV tissue to maternal cfDNA. a Total CG-coverage in cfDNA and CV tissue sample groups for the uCG and 5hmCG signals. Total log2 transformed sequencing coverage of autosomes was computed for each sample and ANOVA was used to test for differences in distributions across sample groups. b CG-fraction in cfDNA and CV tissue sample groups for the uCG and 5hmCG data. Fraction of CGs covered by at least one read to the total number of CGs was computed for each sample and ANOVA was used to test for differences in distributions across sample groups. c Non-metric multidimensional scaling plots of genome-wide signal distribution using two dimensions for uCG and 5hmCG data (using samples after the outlier removal). d Odds ratio (OR) for enrichment of uCG and 5hmCG data across genomic elements (p < 1.6 × 10⁻¹⁰). The genome was divided into 1,000-bp windows and total coverage per sample was averaged across sample groups for each window. Fisher’s exact test was used to test whether the windows with the 10% of the strongest signal are enriched with particular genomic elements. CGI, CG island; lincRNA, long intergenic non-coding RNA

