
Figure 3: Accumulated-tPAINT enables high-resolution tension imaging.
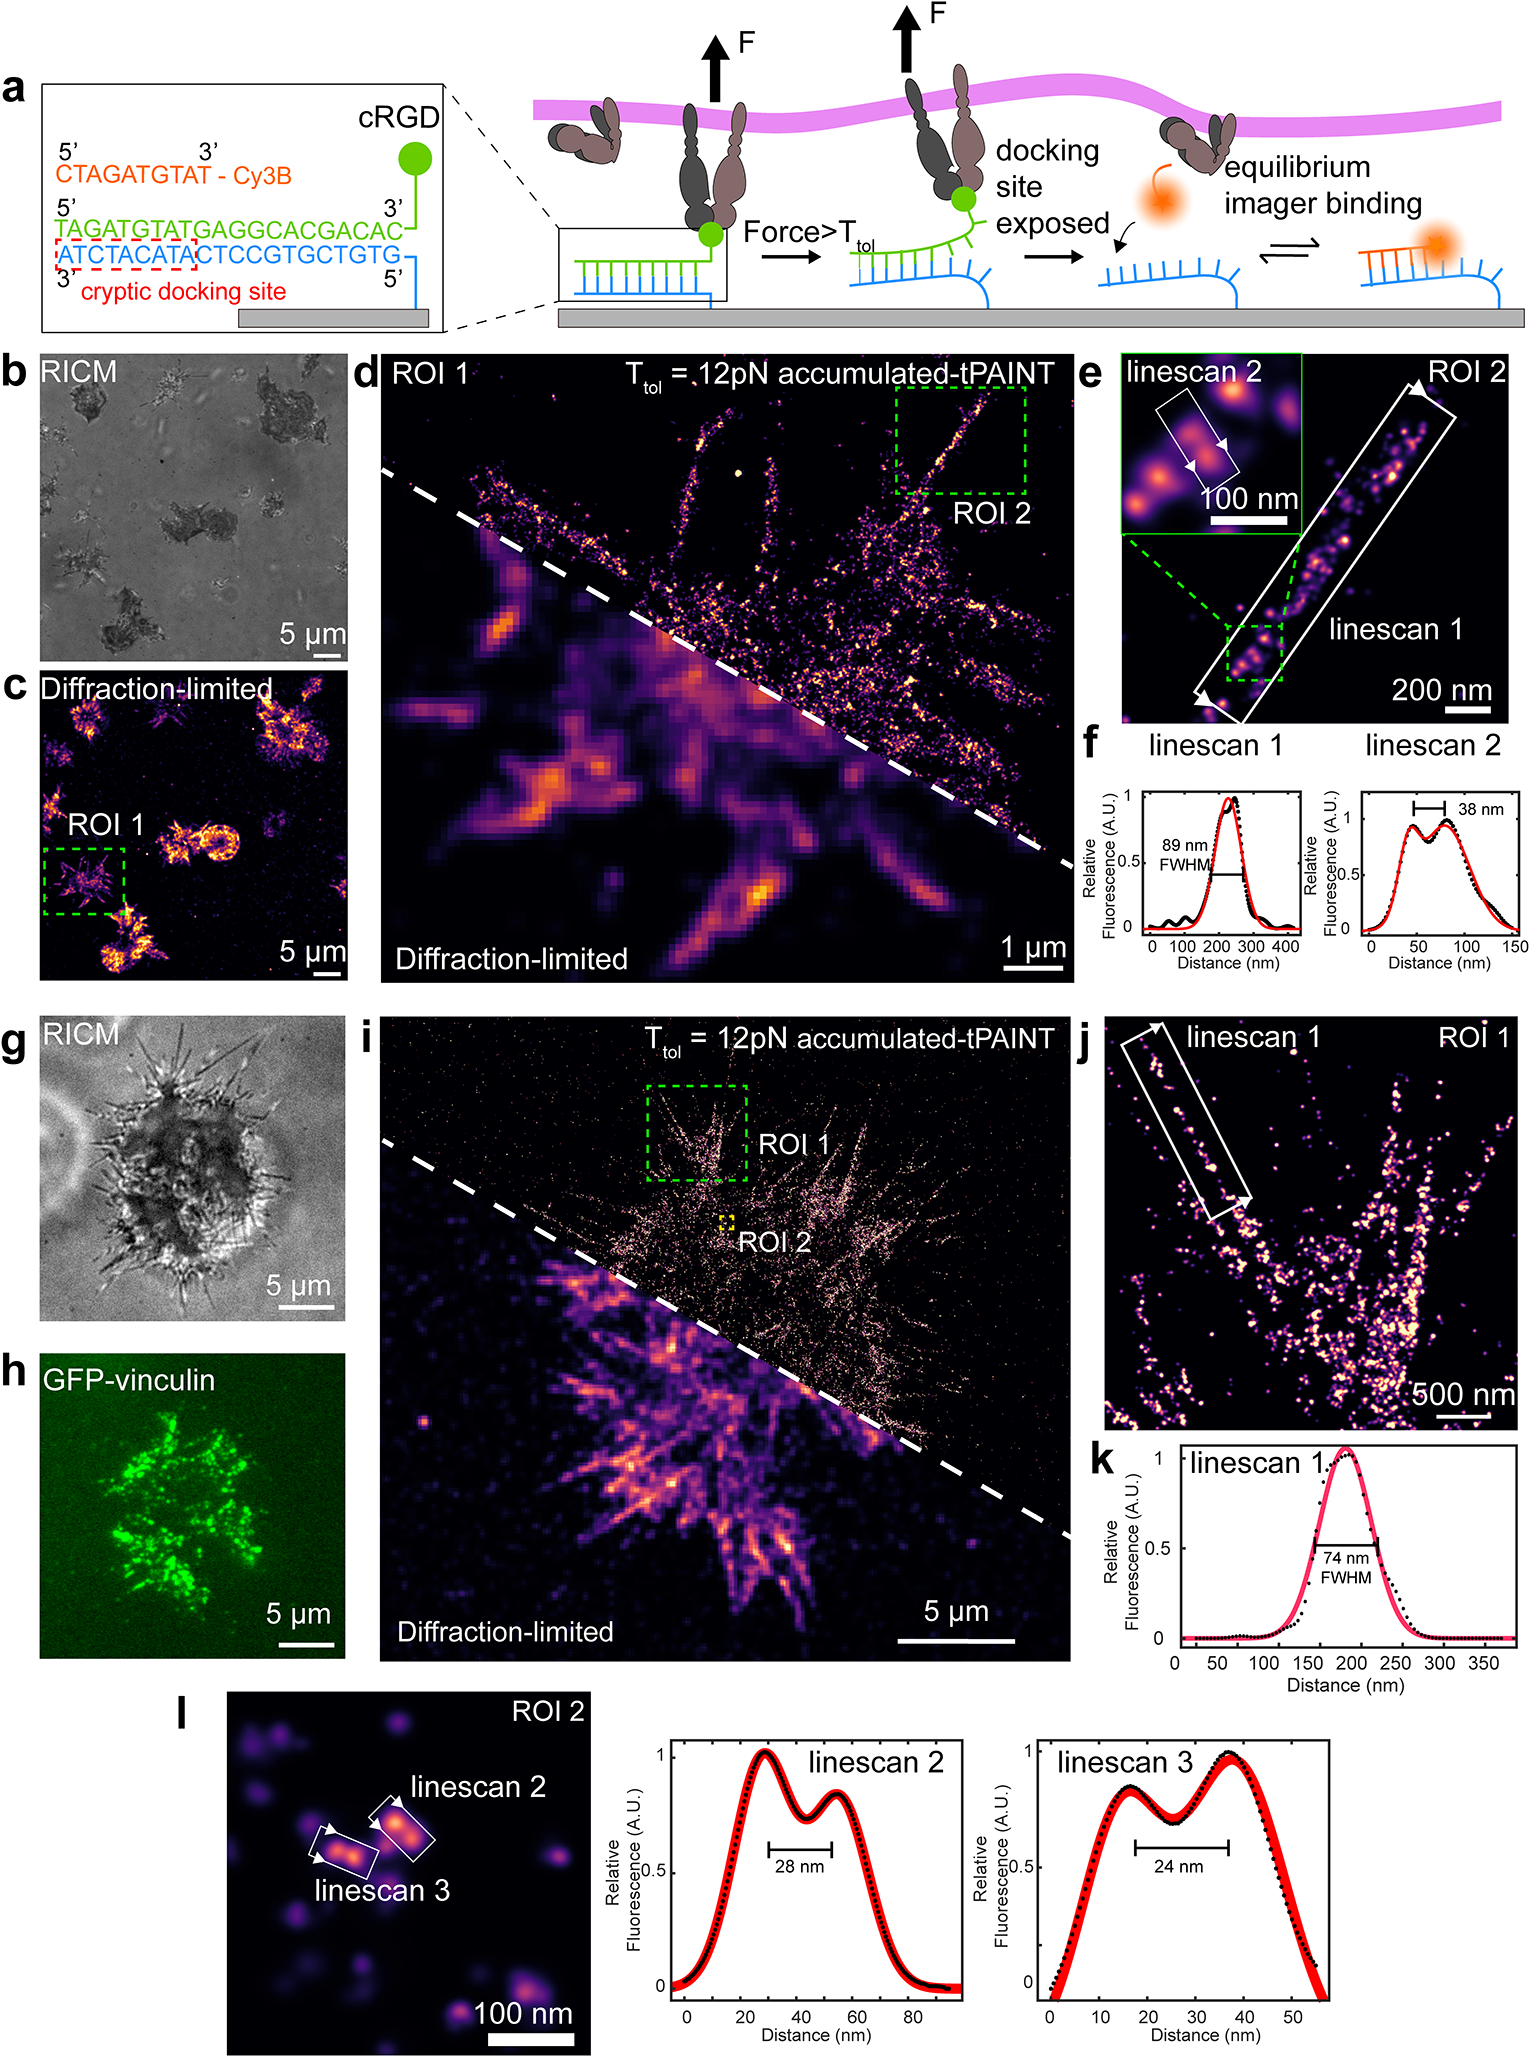
(a) Schematic showing mechanism of accumulated-tPAINT. When integrin F > Ttol, the probe ruptures, exposing a cryptic docking site. Cy3B imager strands transiently bind to this exposed site to report the cellular traction force footprint. (b) and (c) show RICM and diffraction-limited 12 pN tension map of platelets seeded on the surface for 25 min. Color indicates the localization density. (d) Overlay of accumulated tPAINT image with the diffraction-limited reconstruction. (e) Zoom-in of the green ROI noted in d. (f) Linescans of structures noted as i and ii. The direction of the linescan is depicted using white arrows. Red fit is based on a Gaussian with FWHM shown on plots. (g) RICM and (h) GFP vinculin images of MEF cells on an accumulated-tPAINT surface for ~25 min. (i) 12 pN accumulated-tPAINT and diffraction-limited overlay. (j) Zoom-in of ROI indicated by the green rectangle in i. (k) Linescan across the filopodial tension indicated by ROI in j. (l) 12 pN tension hot spots that are separated by 24 and 28 nm. The platelet data shown is representative of n = 8 replicates (22 images) while the fibroblasts data is representative of n = 9 replicates (24 images).