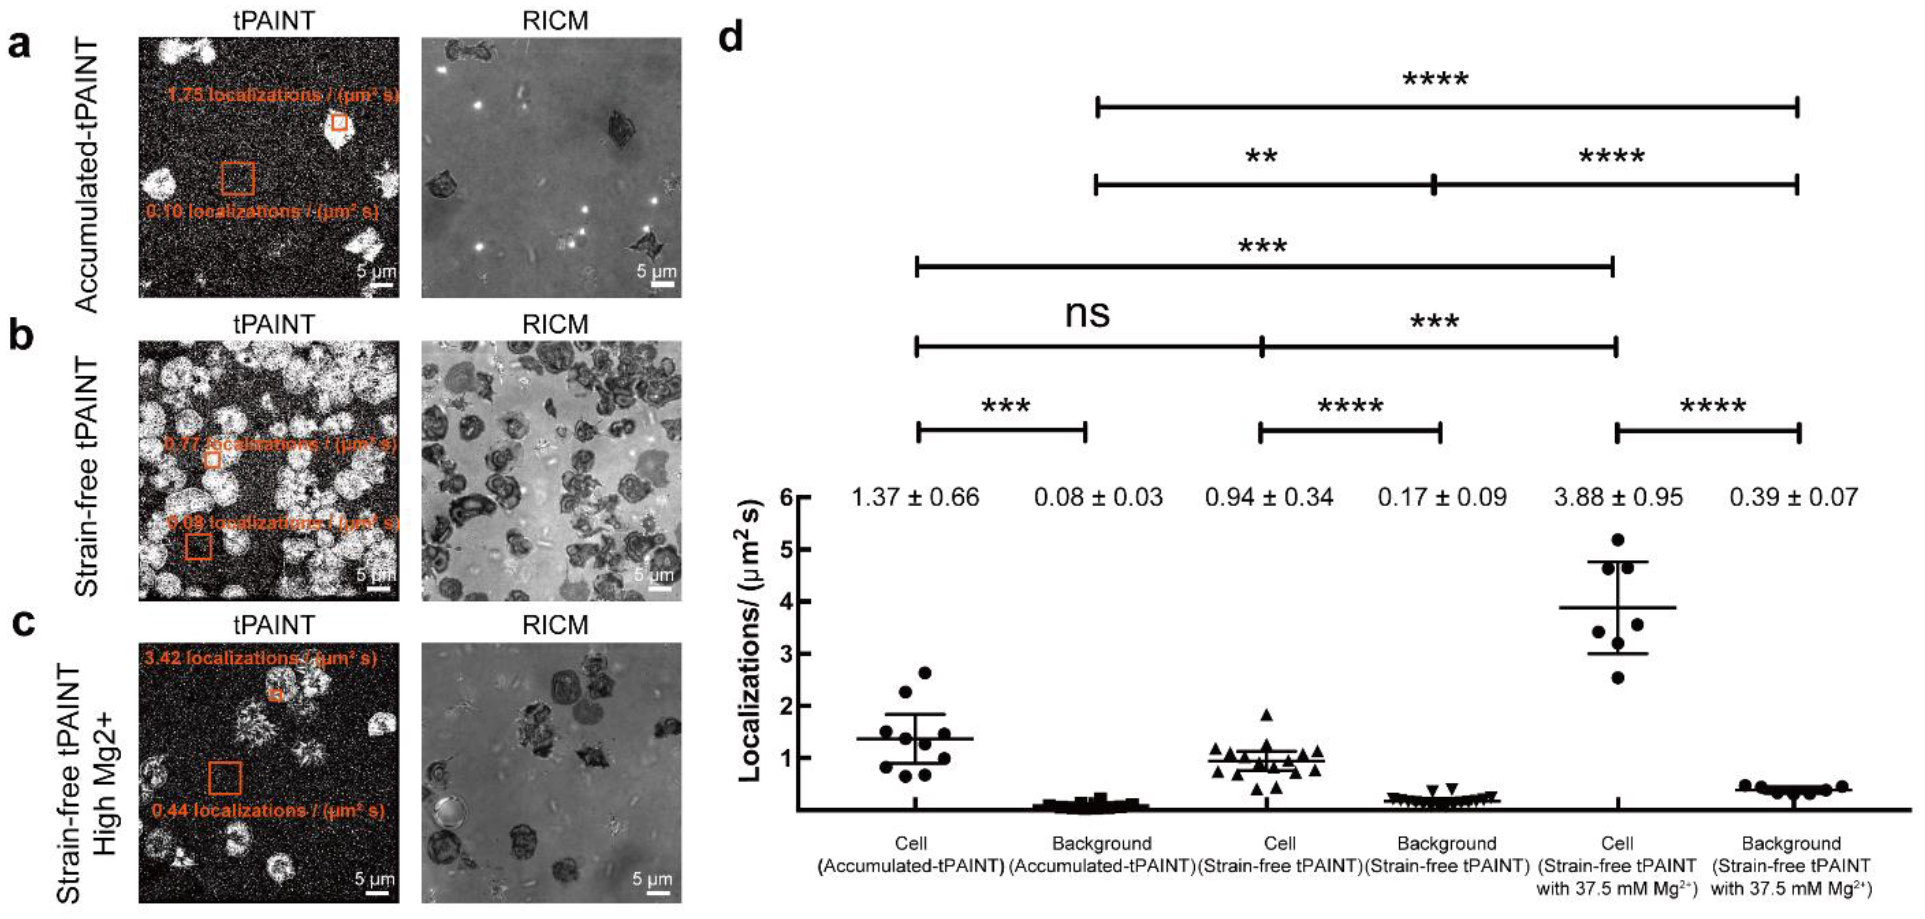
Extended Data Figure 3: Mechanoselection produces a signal-to-background ratio of up to 10 for sf-tPAINT probes and 17 for accumulated-tPAINT probes.

Human platelets were seeded on surfaces presenting cRGD-modified (a) 12pN Ttol accumulated-tPAINT probes at low [Mg2+], (b) sf-tPAINT at low [Mg2+], and (c) sf-tPAINT with 37.5 mM Mg2+. Note that the images displayed are raw-unfiltered single molecule localizations of tPAINT images with the contrast adjusted to emphasize the background localizations. (d) The average per image localizations/(μm2s) for both the background and for the mechanical “footprint” of platelets (3 ROIs per image) is plotted. Results were obtained from n = 4 independent accumulated-tPAINT surfaces, n = 8 sf-tPAINT surfaces and n = 3 high [Mg2+] sf-tPAINT surfaces (10 images for accumulated-tPAINT, 16 images for strain-free, 7 images for high [Mg2+] strain-free). Mean ± standard deviation is noted above each category, error bar is mean with 95% CI. Cell (accumulated-tPAINT): Mean= 1.37, 95% CI 0.89–1.84; Background (accumulated-tPAINT): Mean= 0.08, 95% CI 0.02–0.04; Cell (strain-free tPAINT): Mean= 0.94, 95% CI 0.76–1.13; Background (sf-tPAINT): Mean= 0.17, 95% CI 0.12–0.22. Cell (high [Mg2+] sf-tPAINT): Mean= 3.88, 95% CI 3.00–4.76; Background (high [Mg2+] sf-tPAINT): Mean= 0.39, 95% CI 0.32–0.45. Student’s t-test was (2-tailed, 2 sample) was applied to determine significance. Cell (accumulated-tPAINT) vs Background (accumulated-tPAINT): p = 1.6×10⁻⁴, Cell (strain-free) vs Background (strain-free): p = 1.3×10⁻⁷, Cell (High [Mg2+] strain-free) vs Background (High [Mg2+] strain-free): p = 6.5×10⁻⁵, Cell (accumulated-tPAINT) vs Cell (strain-free): p = 8.5×10⁻², Cell (accumulated-tPAINT) vs Cell (High [Mg2+] strain-free): p = 1.3×10⁻⁴, Cell (strain-free) vs Cell (High [Mg2+] strain-free): p = 1.2×10⁻⁴, Background (accumulated-tPAINT) vs Background (strain-free): p = 8.4×10⁻⁵. Background (accumulated-tPAINT) vs Background (strain-free): p = 5.2×10⁻³, Background (accumulated-tPAINT) vs Background (High [Mg2+] strain-free): p = 1.1×10⁻⁶, Background (strain-free) vs Background (High [Mg2+] strain-free): p = 1.7×10⁻⁵.
