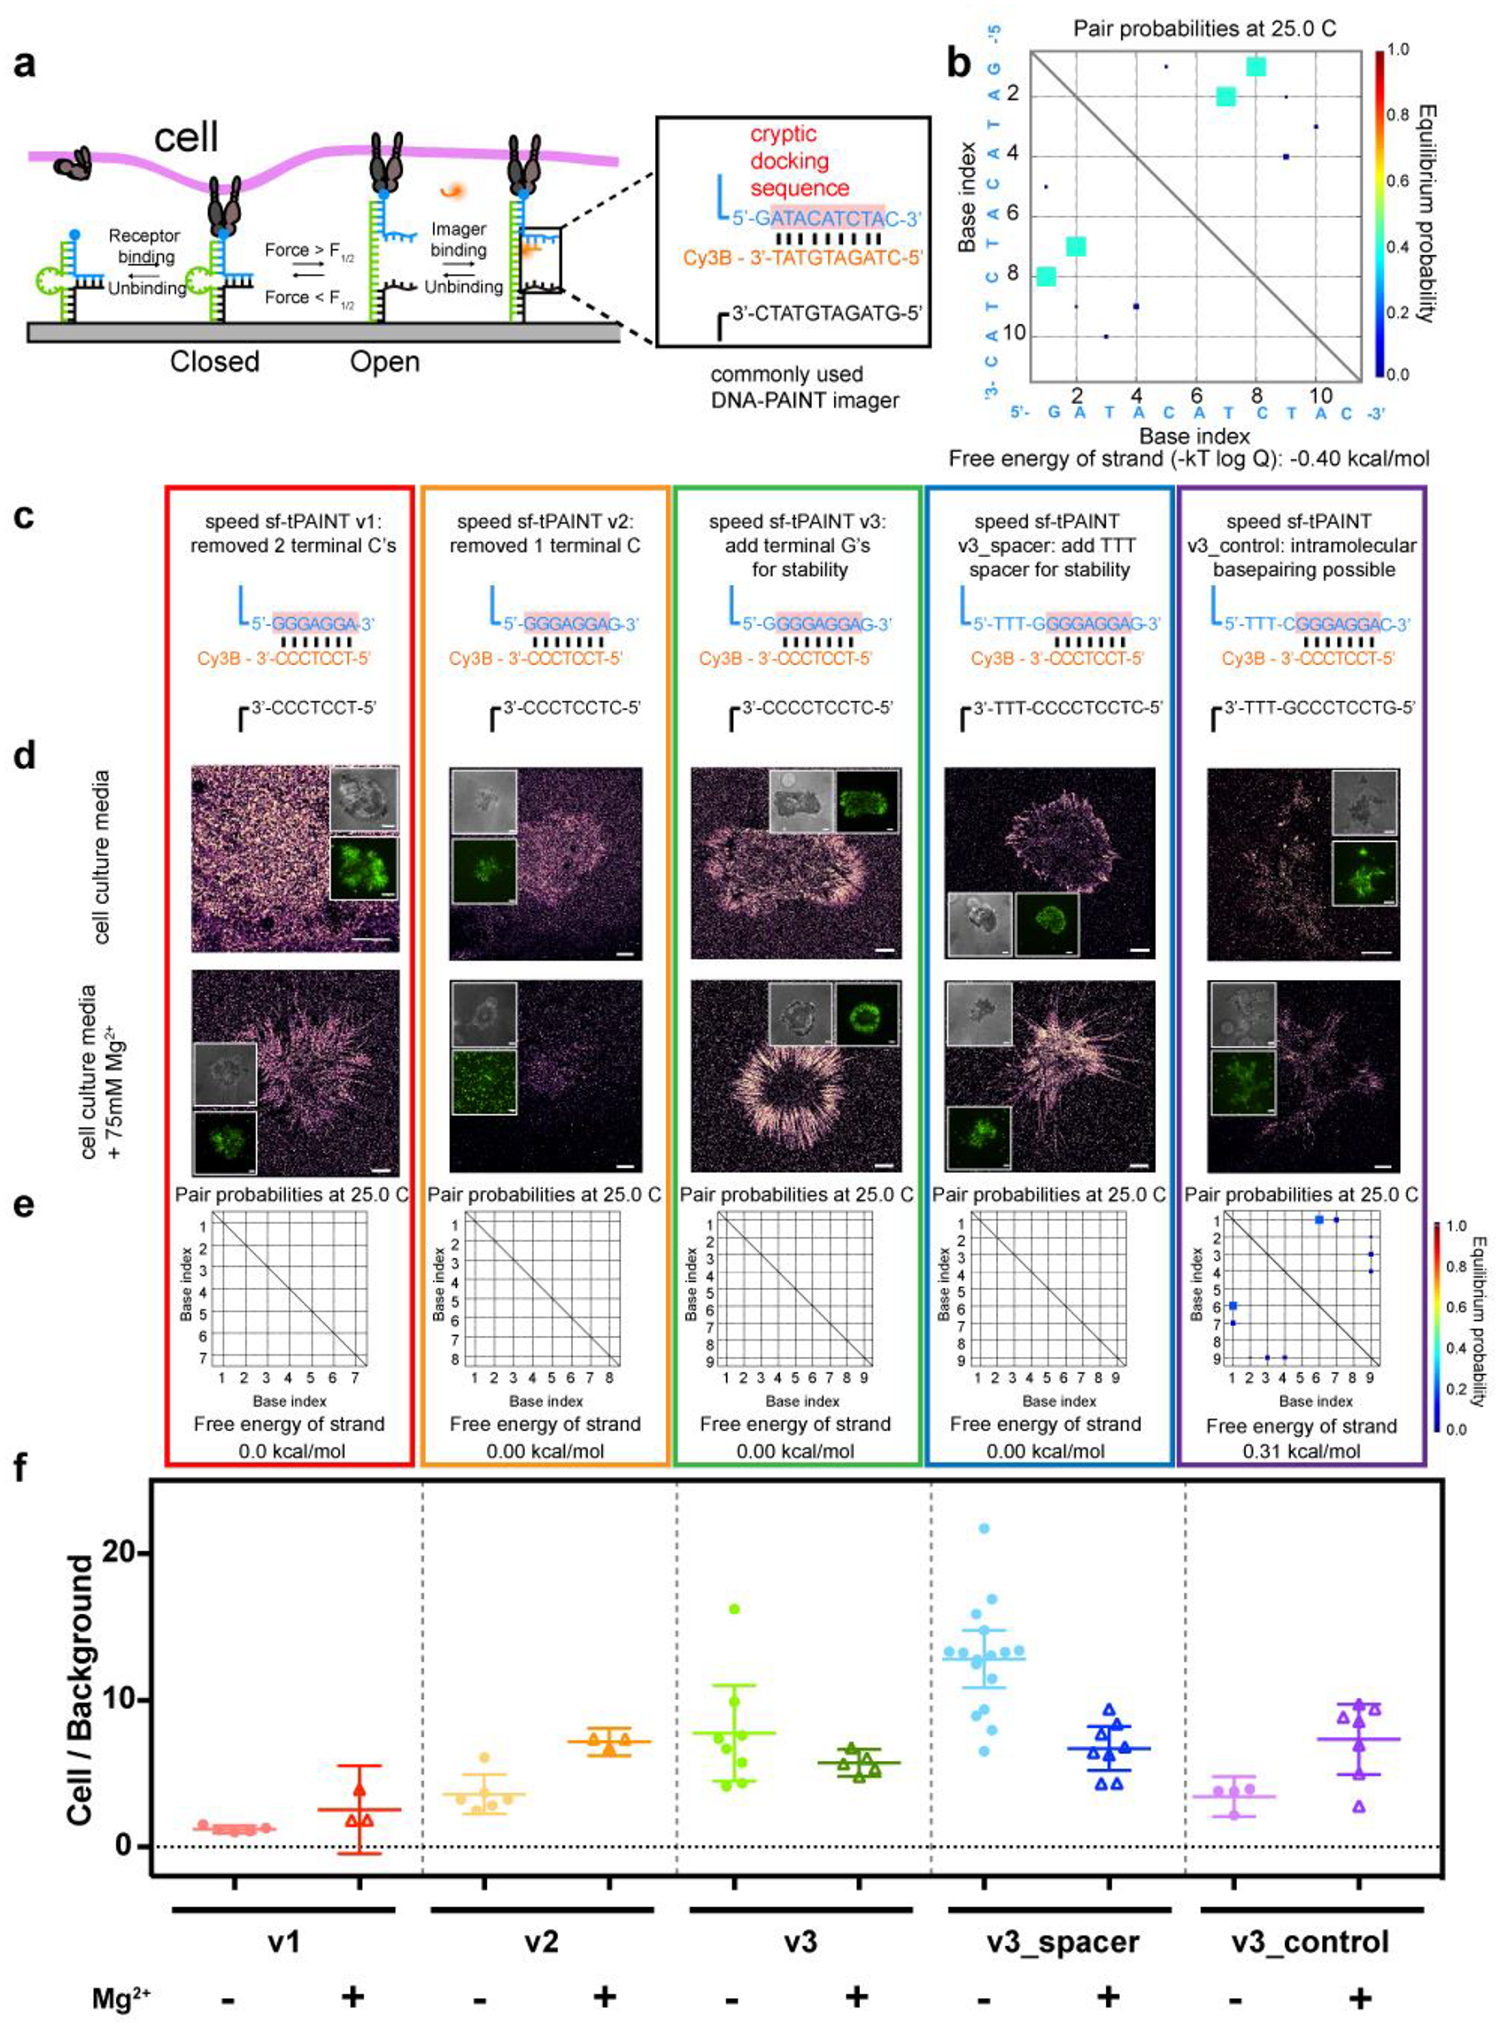
Extended Data Figure 5: Design of speed-optimized strain-free tPAINT probes.

(a) Schematic of sf-tPAINT probes. (b) NUPACK modeling of self-base-pairing propensity of the imager. (c) Sequences/designs of speed-optimized sf-tPAINT docking sites (blue) that avoid self-interaction. Imager docking site highlighted in pink. (d) Representative speed sf-tPAINT images of MEF GFP-vinculin cells imaged in cell culture media (~0.8 mM Mg2+) and in 75 mM Mg2+ supplemented media. (e) NUPACK modeling of speed sf-tPAINT probes. (f) Ratio of tPAINT localizations versus background localizations. Each point in (f) is a single cell. Number of replicates: v1_no Mg2+ (5 cells, n =3 experiments), v1_ Mg2+ (3 cells, n = 3 experiments), v2_no Mg2+(6 cells, n = 3 experiments), v2_Mg2+ (3 cells, n = 3 experiments), v3_no Mg2+ (8 cells, n = 3 experiments), v3_Mg2+(5 cells, n = 3 experiments), and v3_spacer_no Mg2+(16 cells, n = 4 experiments), v3_spacer_Mg2+ (8 cells, n = 4 experiments), v3_control_no Mg2+ (4 cells, n = 4 experiments), v3_control_Mg2+ (7 cells, n = 3 experiments). All scale bars are 5 μm. Data were compared via a 2-way ANOVA. v3_spacer (in the no added Mg2+ case) is statistically different from v1 (p=5.3×10⁻¹⁰), v2 (p=6.4×10⁻⁸), v3 (p = 0.0022), and v3_control (p=2.2×10⁻⁶). The v3_spacer exhibits the greatest signal-to-noise ratio. Data in f is displayed as mean with 95% CI. v1 (no Mg2+) Mean= 1.21, CI 0.96–1.46, sd 0.20; v1 (Mg2+) Mean= 2.54, CI 0.47–5.55, sd 1.21; v2 (no Mg2+) Mean= 3.60, CI 2.24–4.95, sd 1.29; v2 (Mg2+) Mean= 7.17, CI 6.23–8.11, sd 0.38; v3 (no Mg2+) Mean= 7.76, CI 4.49–11.02, sd 3.90; v3 (Mg2+) Mean= 5.73, CI 4.81–6.66, sd 0.74; v3_spacer (no Mg2+) Mean= 12.82, CI 10.86–14.78, sd 3.67; v3_spacer (Mg2+) Mean= 6.72, CI 5.22–8.22, sd 1.80; v3_control (no Mg2+) Mean= 3.43, CI 2.09–4.78, sd 0.84; v3_control (Mg2+) Mean= 7.34, CI 4.95–9.74, sd 2.59.
