
Extended Data Figure 8: Cellular tension feature dimensions depend on the imaging window in sf-tPAINT.
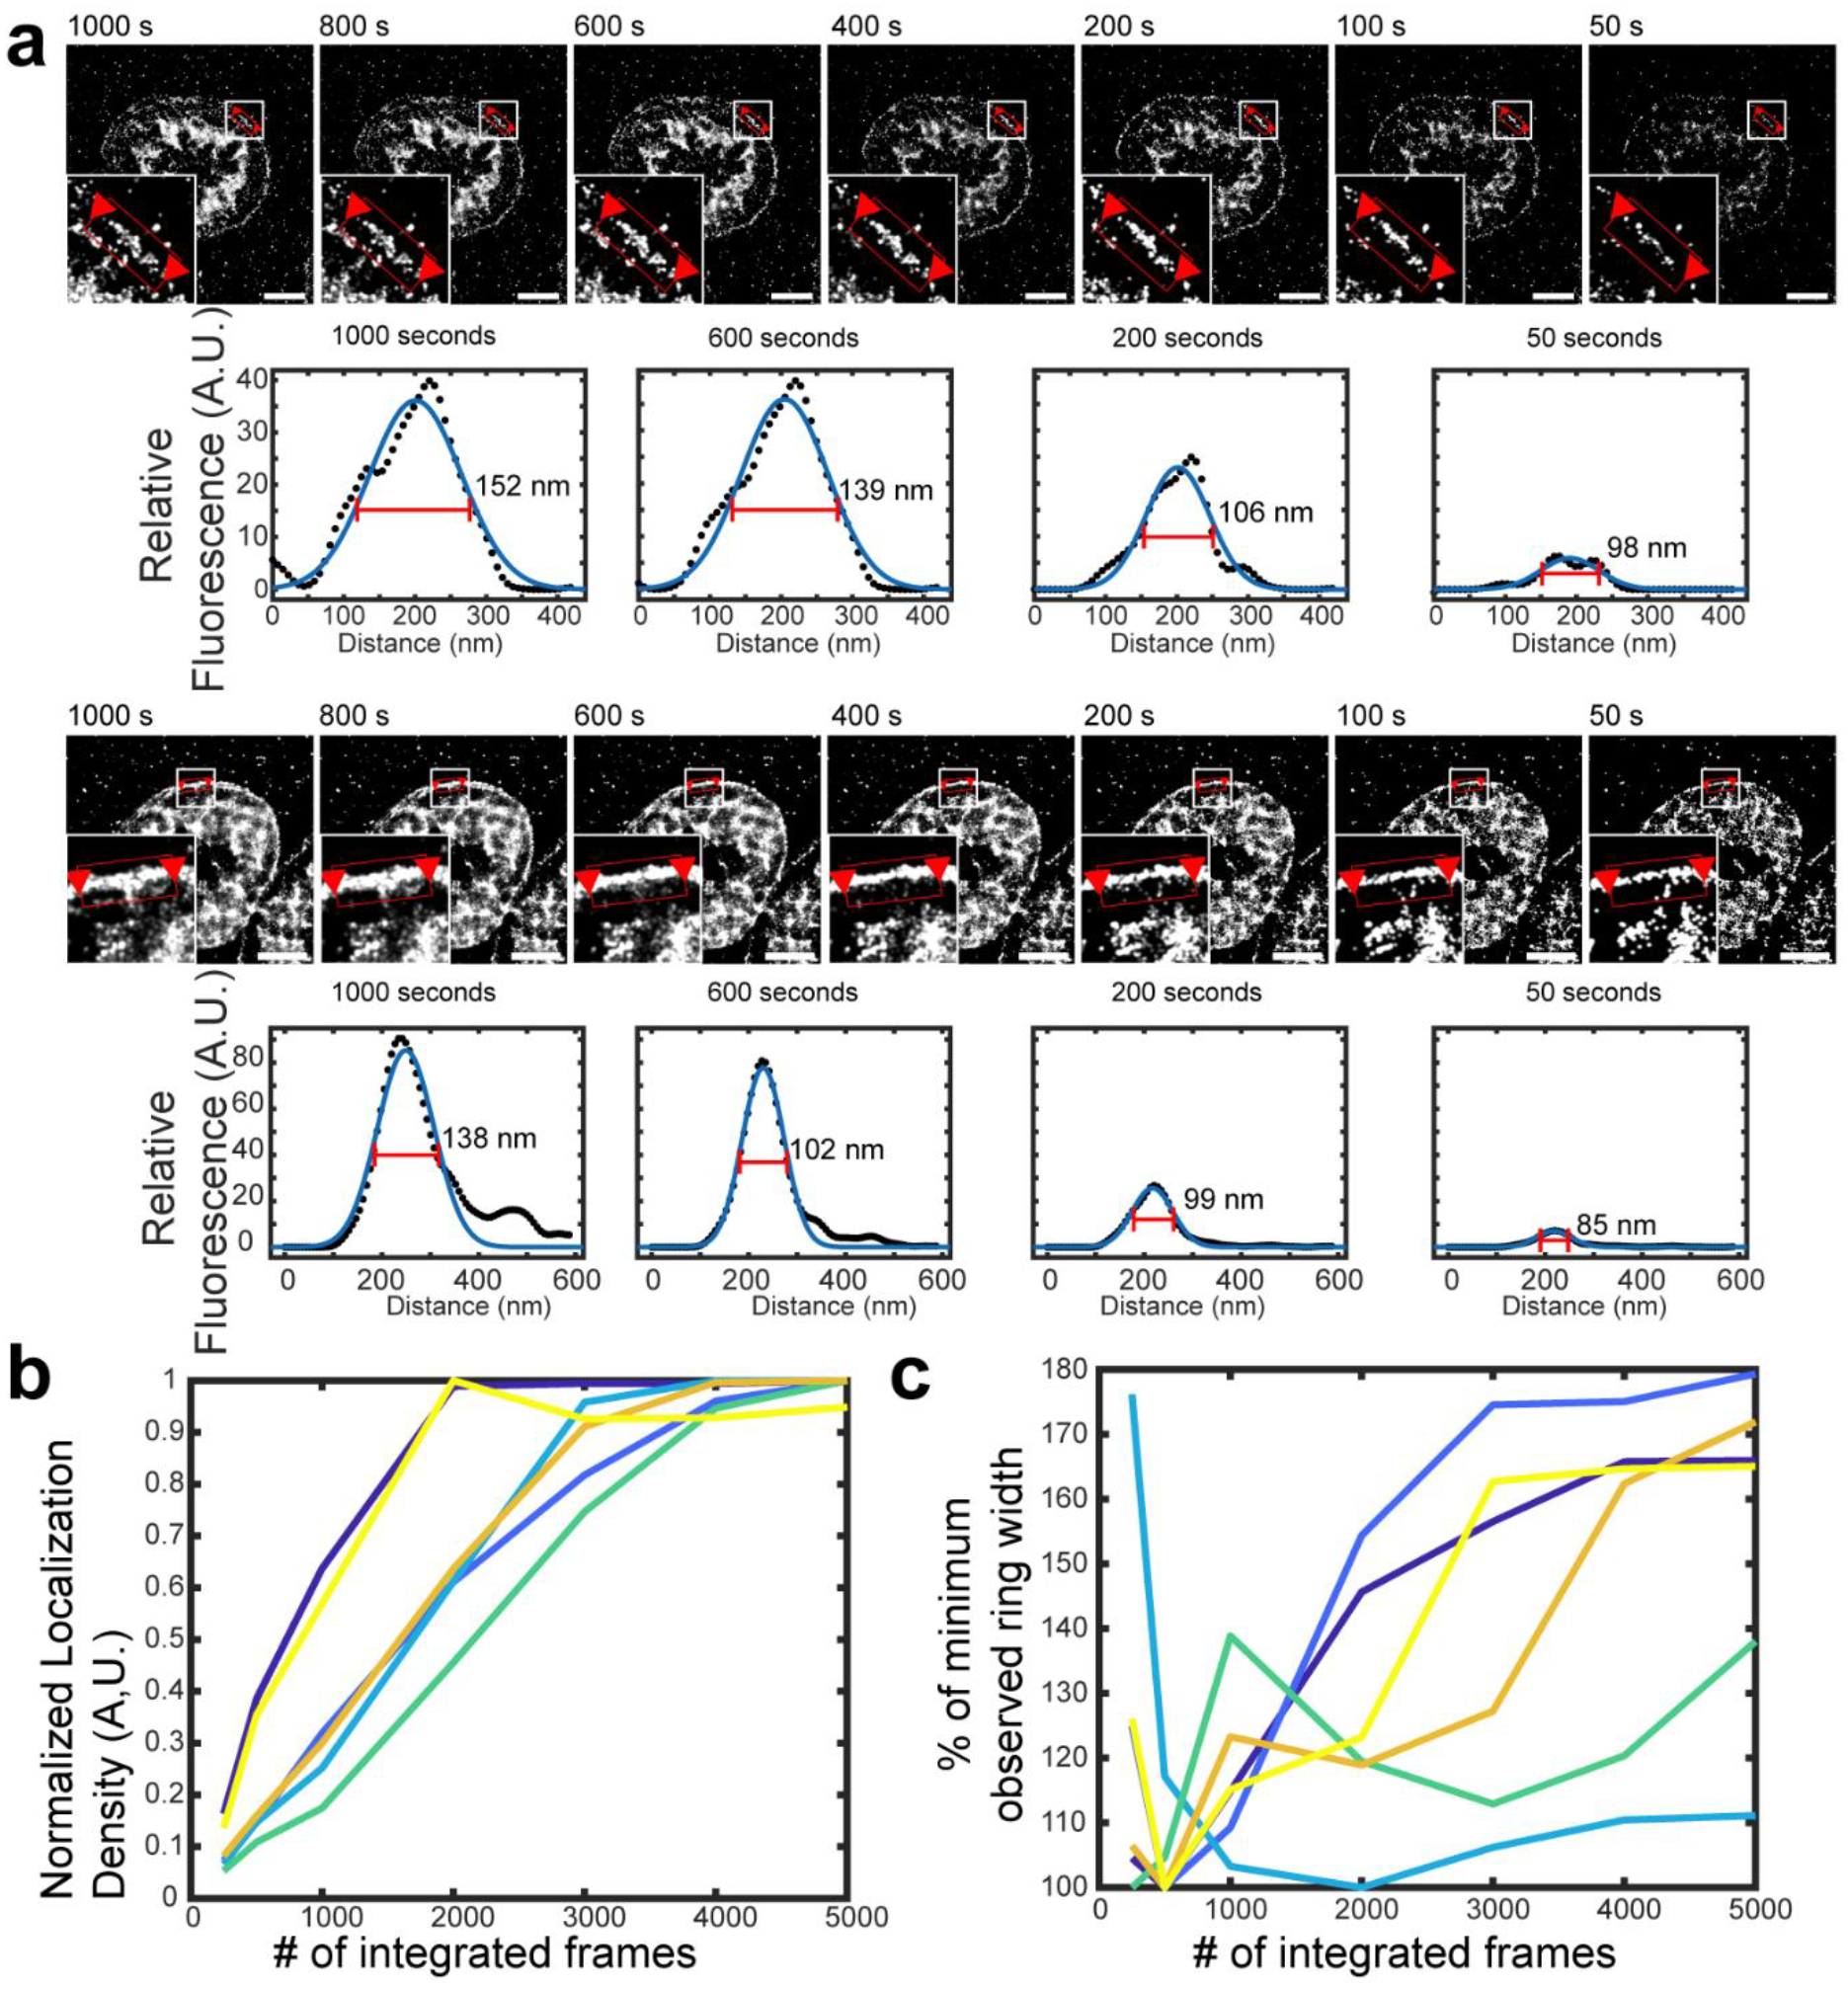
(a) Live-cell sf-tPAINT imaging of platelet tension displayed using different time windows (ranging from 50 sec to 1000 sec). The apparent length or width of cellular tension features depends on the number of frames that are integrated to produce a super-resolved image. To demonstrate this point, we rendered the lamellipodial edge of 3 human platelets (from n = 3 independent experiments, 2 platelets shown) and measured the apparent width of the lamellipodial edge tension ring as tPAINT data is integrated over various time windows. Super-resolved tPAINT images were rendered as greyscale images, and ring width was measured via linescan analysis (black dots). The data were fit to a gaussian via Matlab’s curvefitting tool (blue line). The measured FWHM of the fitted gaussians depends on the number of frames integrated to produce the super-resolved tPAINT image. (b) Plot showing that the localization density generally increased with increasing the number of integrated frames. Each color shows a unique ROI. (c) Plot showing the relation between the FWHM of the tension ring and the number of integrated frames. The data shown are from 3 human platelets from n = 3 independent experiments (2 linescans per platelet). In principle, it is desirable to use the minimum number of frames possible to render an image in order to minimize feature blurring due to cellular dynamics during the imaging window; however, image quality decreases, with localizations becoming more punctate, when fewer frames are integrated. To produce high-quality tPAINT images, these considerations must both be balanced. All scale bars are 2 μm.