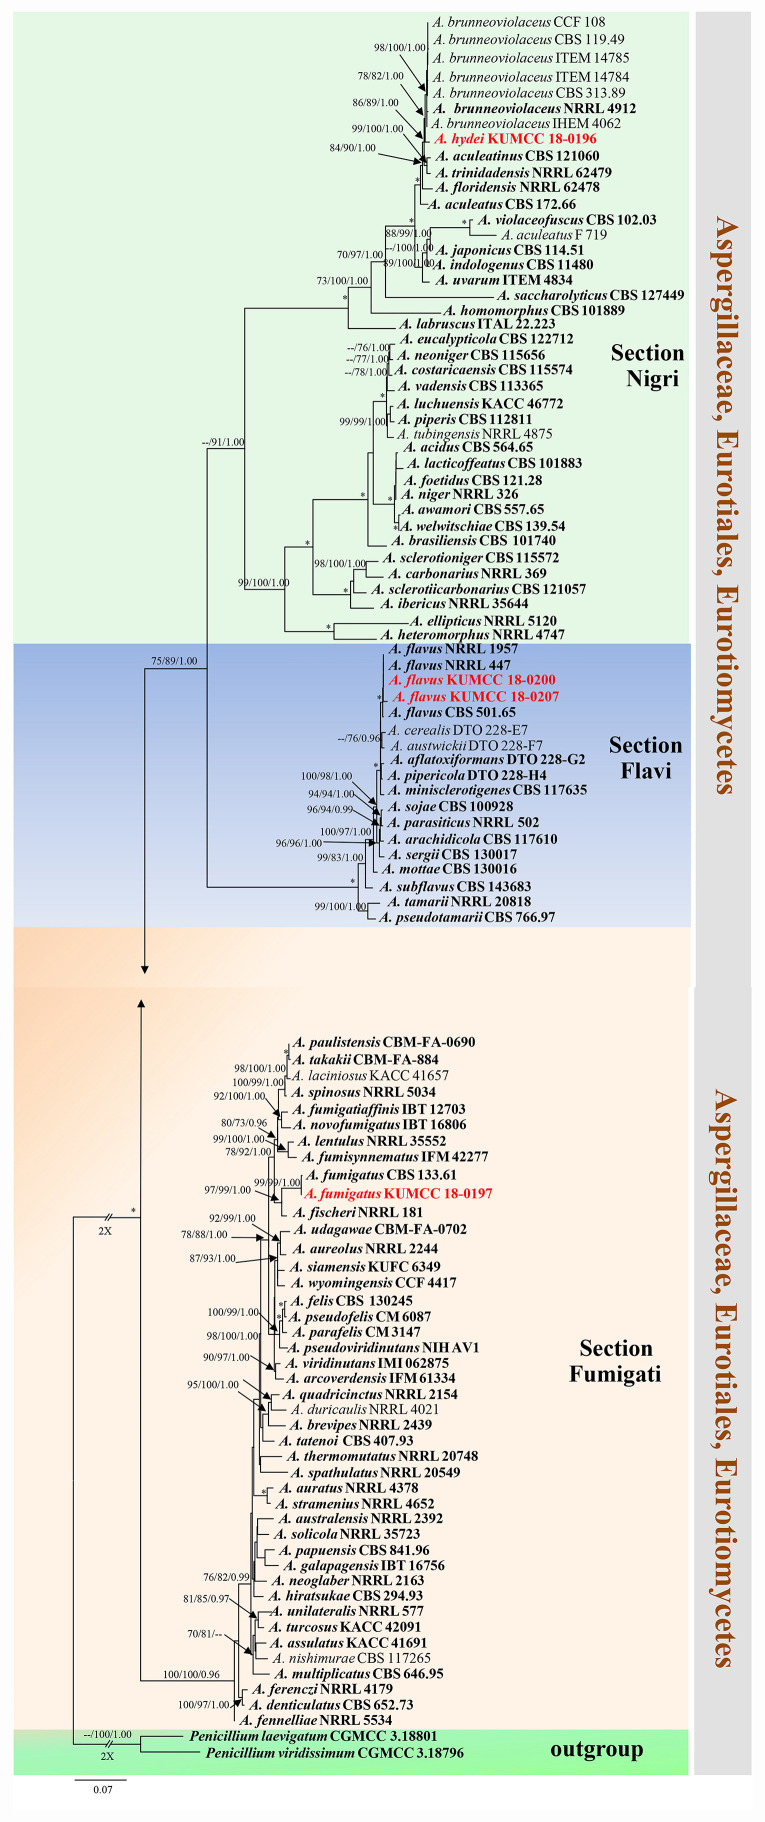
FIGURE 6.
Phylogram generated from maximum likelihood analysis based on combined CaM, BenA, ITS and RPB2 sequence data. One hundred and three sequences are included in the combined analysis, which consisted of 2805 characters including alignment gaps. The tree is rooted to Penicillium viridissimum (CGMCC 3.18796) and P. laevigatum (CGMCC 3.18801). The MP analysis for the combined dataset had 1199 parsimony informative, 1432 constant, 174 parsimony uninformative and yielded 356 most parsimonious trees. The best-fit model HKY + I + G was selected for CaM, BenA, GTR + I + G for ITS and RPB2 in BI analysis. Maximum parsimony and maximum likelihood bootstrap values ≥ 70% and Bayesian posterior probabilities ≥ 0.90 (MPBS/MLBS/BYPP) are indicated at the nodes. Branches with 100% MPBS, 100% MLBS and 1.00 BYPP values are indicated as an asterisk (∗). The ex-type strains are bolded black, and the new isolates are in red.

