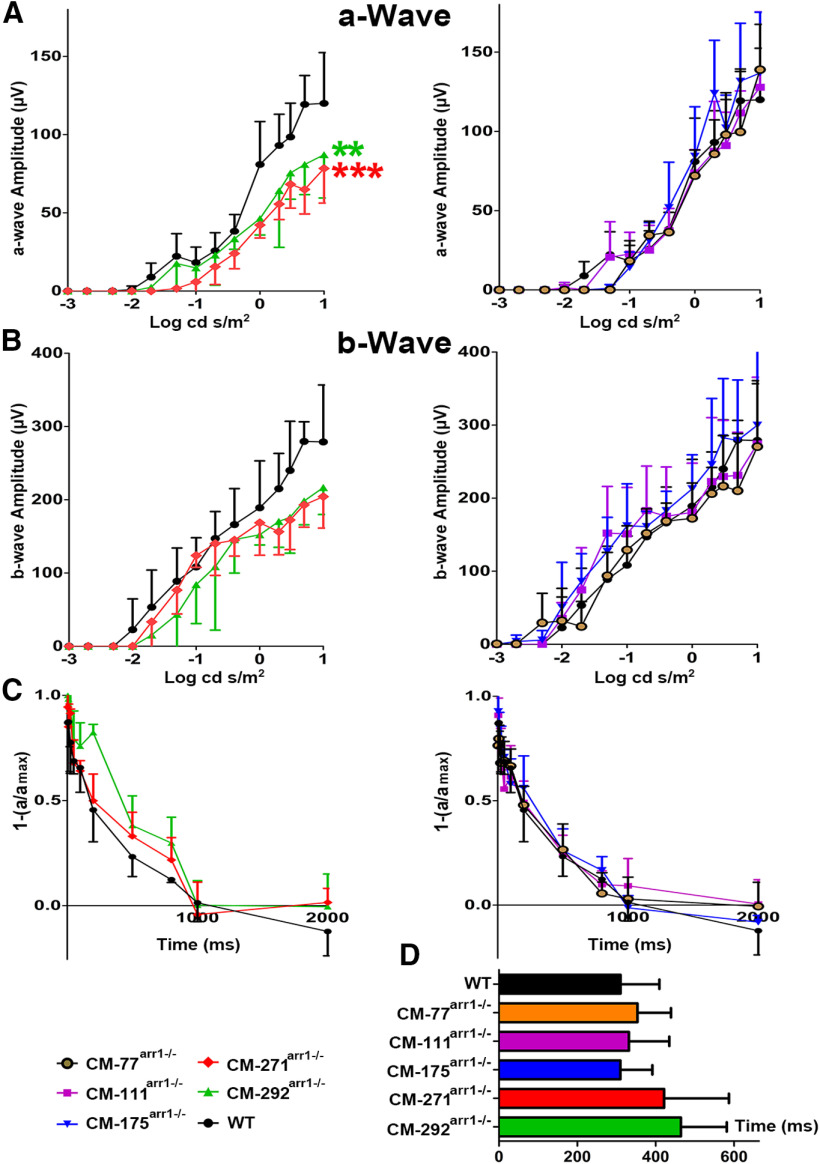
Figure 3.
Functional performance of rods in mice expressing different levels of CM. ERG responses to single flashes of increasing intensity in mice of indicated genotypes were recorded, as described in Materials and Methods. A, B, The a-wave (A) and b-wave (B) amplitudes were plotted as a function of flash intensity. Mean ± SEM values from five animals per genotype are shown. The a-wave responses of higher expressors were lower than those of WT mice. Data analysis by repeated-measures ANOVA with flash intensity as the within-group factor and genotype as the between-group factor revealed a highly significant effect of CM concentration on a-wave amplitude (p < 0.001). The genotype × flash intensity interaction was highly significant (p < 0.001), indicating differences in the shape of the curve. The mean values for the mutant mouse lines were compared with WT mice for every intensity using Dunnett's multiple post hoc comparison test. **p < 0.01, ***p < 0.001, compared with WT mice for all flash intensities ≥0. There were no significant differences in b-wave between any mutant line and WT mice. C, The normalized amplitude of the probe flash a-wave was plotted as a function of time elapsed after the first flash. The intensities of the first (desensitizing) and second (probe) flash were 0.4 and 0.65 log cd * s/m2, respectively. The interval between two flashes was varied from 50 to 2000 ms. To calculate the Thalf, recovery kinetics were fitted by polynomial nonlinear regression, with R2 > 0.95, as described in Materials and Methods. D, Calculated Thalf. The mean ± SD values for five animals per genotype are shown.

