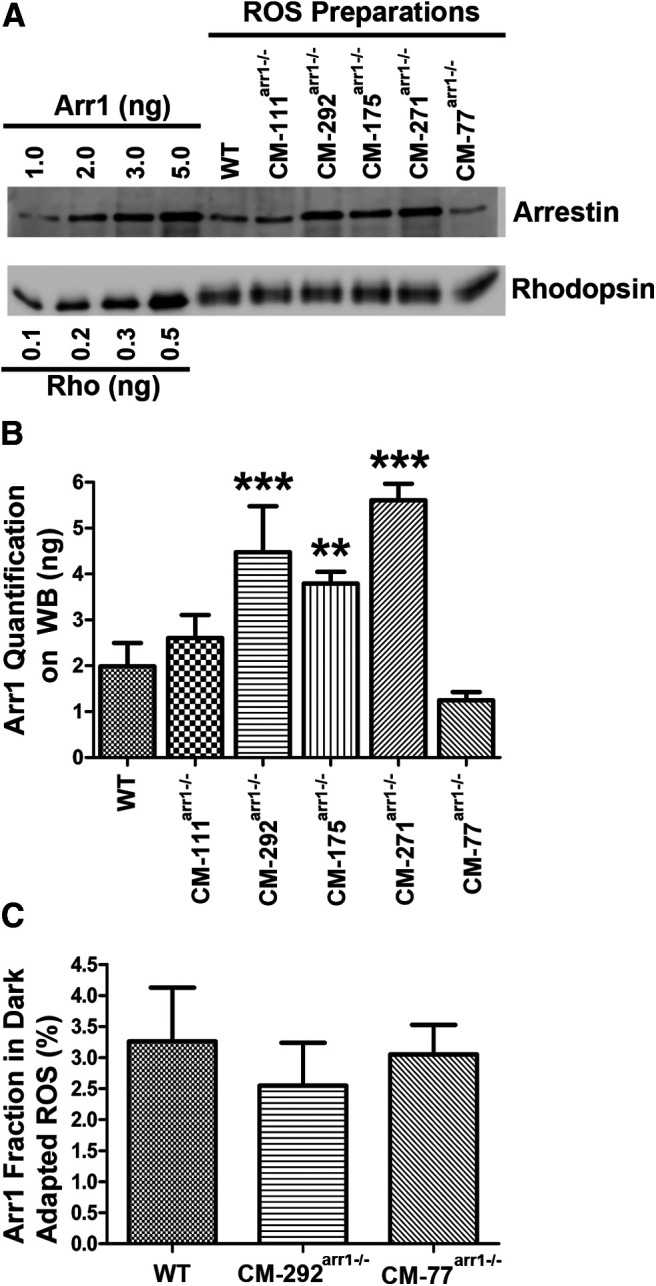
Figure 6.

The expression of CM and its presence in the OS of dark-adapted rods. A, Western blot showing the levels of arrestin in the OS preparations in WT, and different transgenic lines, with indicated amounts of corresponding purified proteins used as standards. Arr1 and rhodopsin were measured by quantitative Western blot, as described previously (Song et al., 2011). Blots of representative samples (of three per genotype used) are shown. The amounts of rhodopsin were equalized to show the differences in Arr1 levels. B, Absolute amount of Arr1 in the OS of dark-adapted mice of indicated genotypes. Arr1 in each transgenic line was measured by quantitative Western blot in three independent OS preparations. Mean ± SD values are shown. Statistical significance of the differences is indicated, as follows (one-way ANOVA with genotype as the main factor followed by Bonferroni's multiple-comparison test): **p < 0.01; ***p < 0.001. C, The proportion of CM localized in rod OS of dark-adapted mice. The fraction of Arr1 in the dark-adapted OS was quantified by Western blot. The level of contamination by the IS material was determined by comparison of mitochondrial marker COX IV present in the whole retina and OS preparation. The fraction of Arr1 in the IS for correction purposes was determined by immunohistochemistry (Fig. 7) in three images per animal from three animals per genotype per dark condition. Mean ± SD values are shown. Additional data for CM-111arr−/−, CM-175arr−/−, and CM-271arr−/− lines are shown in Figure 7.
