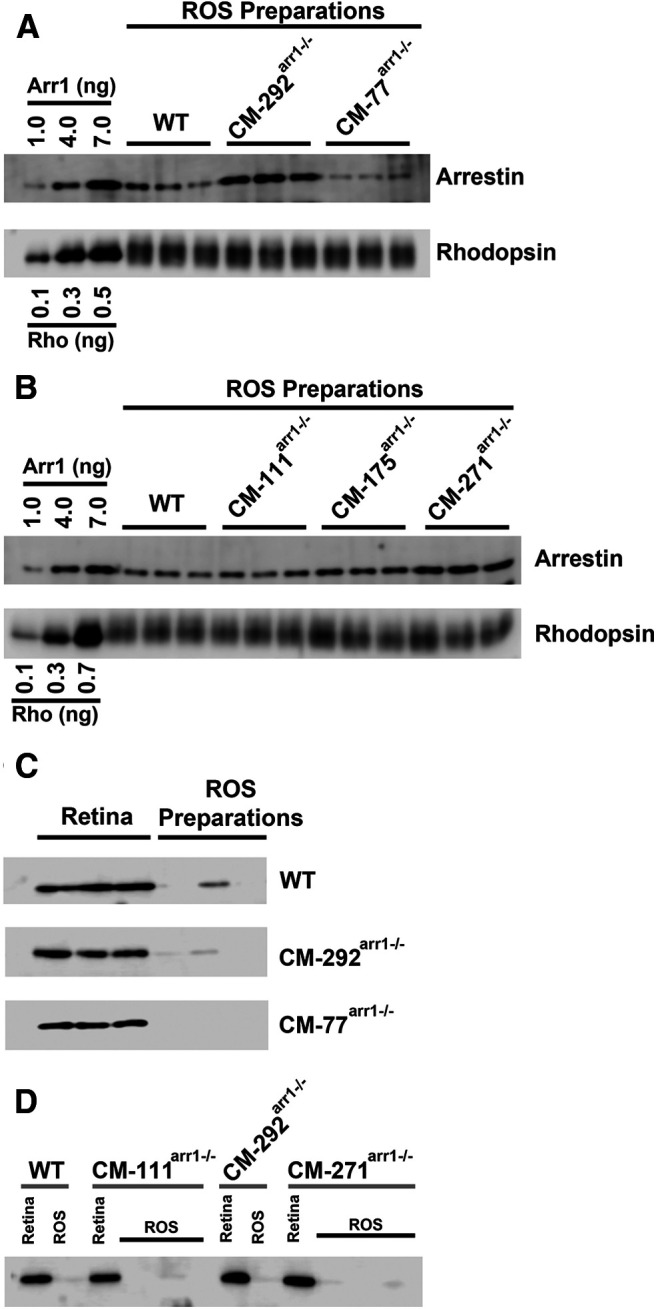
Figure 7.

The expression of CM and levels in OSs in different transgenic lines. A, B, Western blot showing the levels of arrestin-1 in the rod outer segments in WT and different transgenic lines, with indicated amounts of corresponding purified proteins used as standards. Arr1 and rhodopsin were measured by quantitative Western blot, as described previously (Song et al., 2011). Three independent OS preparations used for each genotype are shown. The amounts of rhodopsin (Rho) were equalized to show the differences in Arr1 levels. C, D, To test the purity of the OS fraction and the extent of contamination with inner segment material, aliquots of whole retina (containing 30 ng of rhodopsin) and ROS homogenates (containing 150 ng of rhodopsin) from mice of indicated genotypes were run side by side on an SDS-PAGE gel. Western blots were developed with rabbit polyclonal antibody against mitochondrial marker COX IV (catalog #11-035-144, Jackson ImmunoResearch) and HRP-conjugated secondary anti-rabbit antibody (catalog #4844, Cell Signaling Technology). Only blots where calibration curves showed r2 > 0.95 were used.
