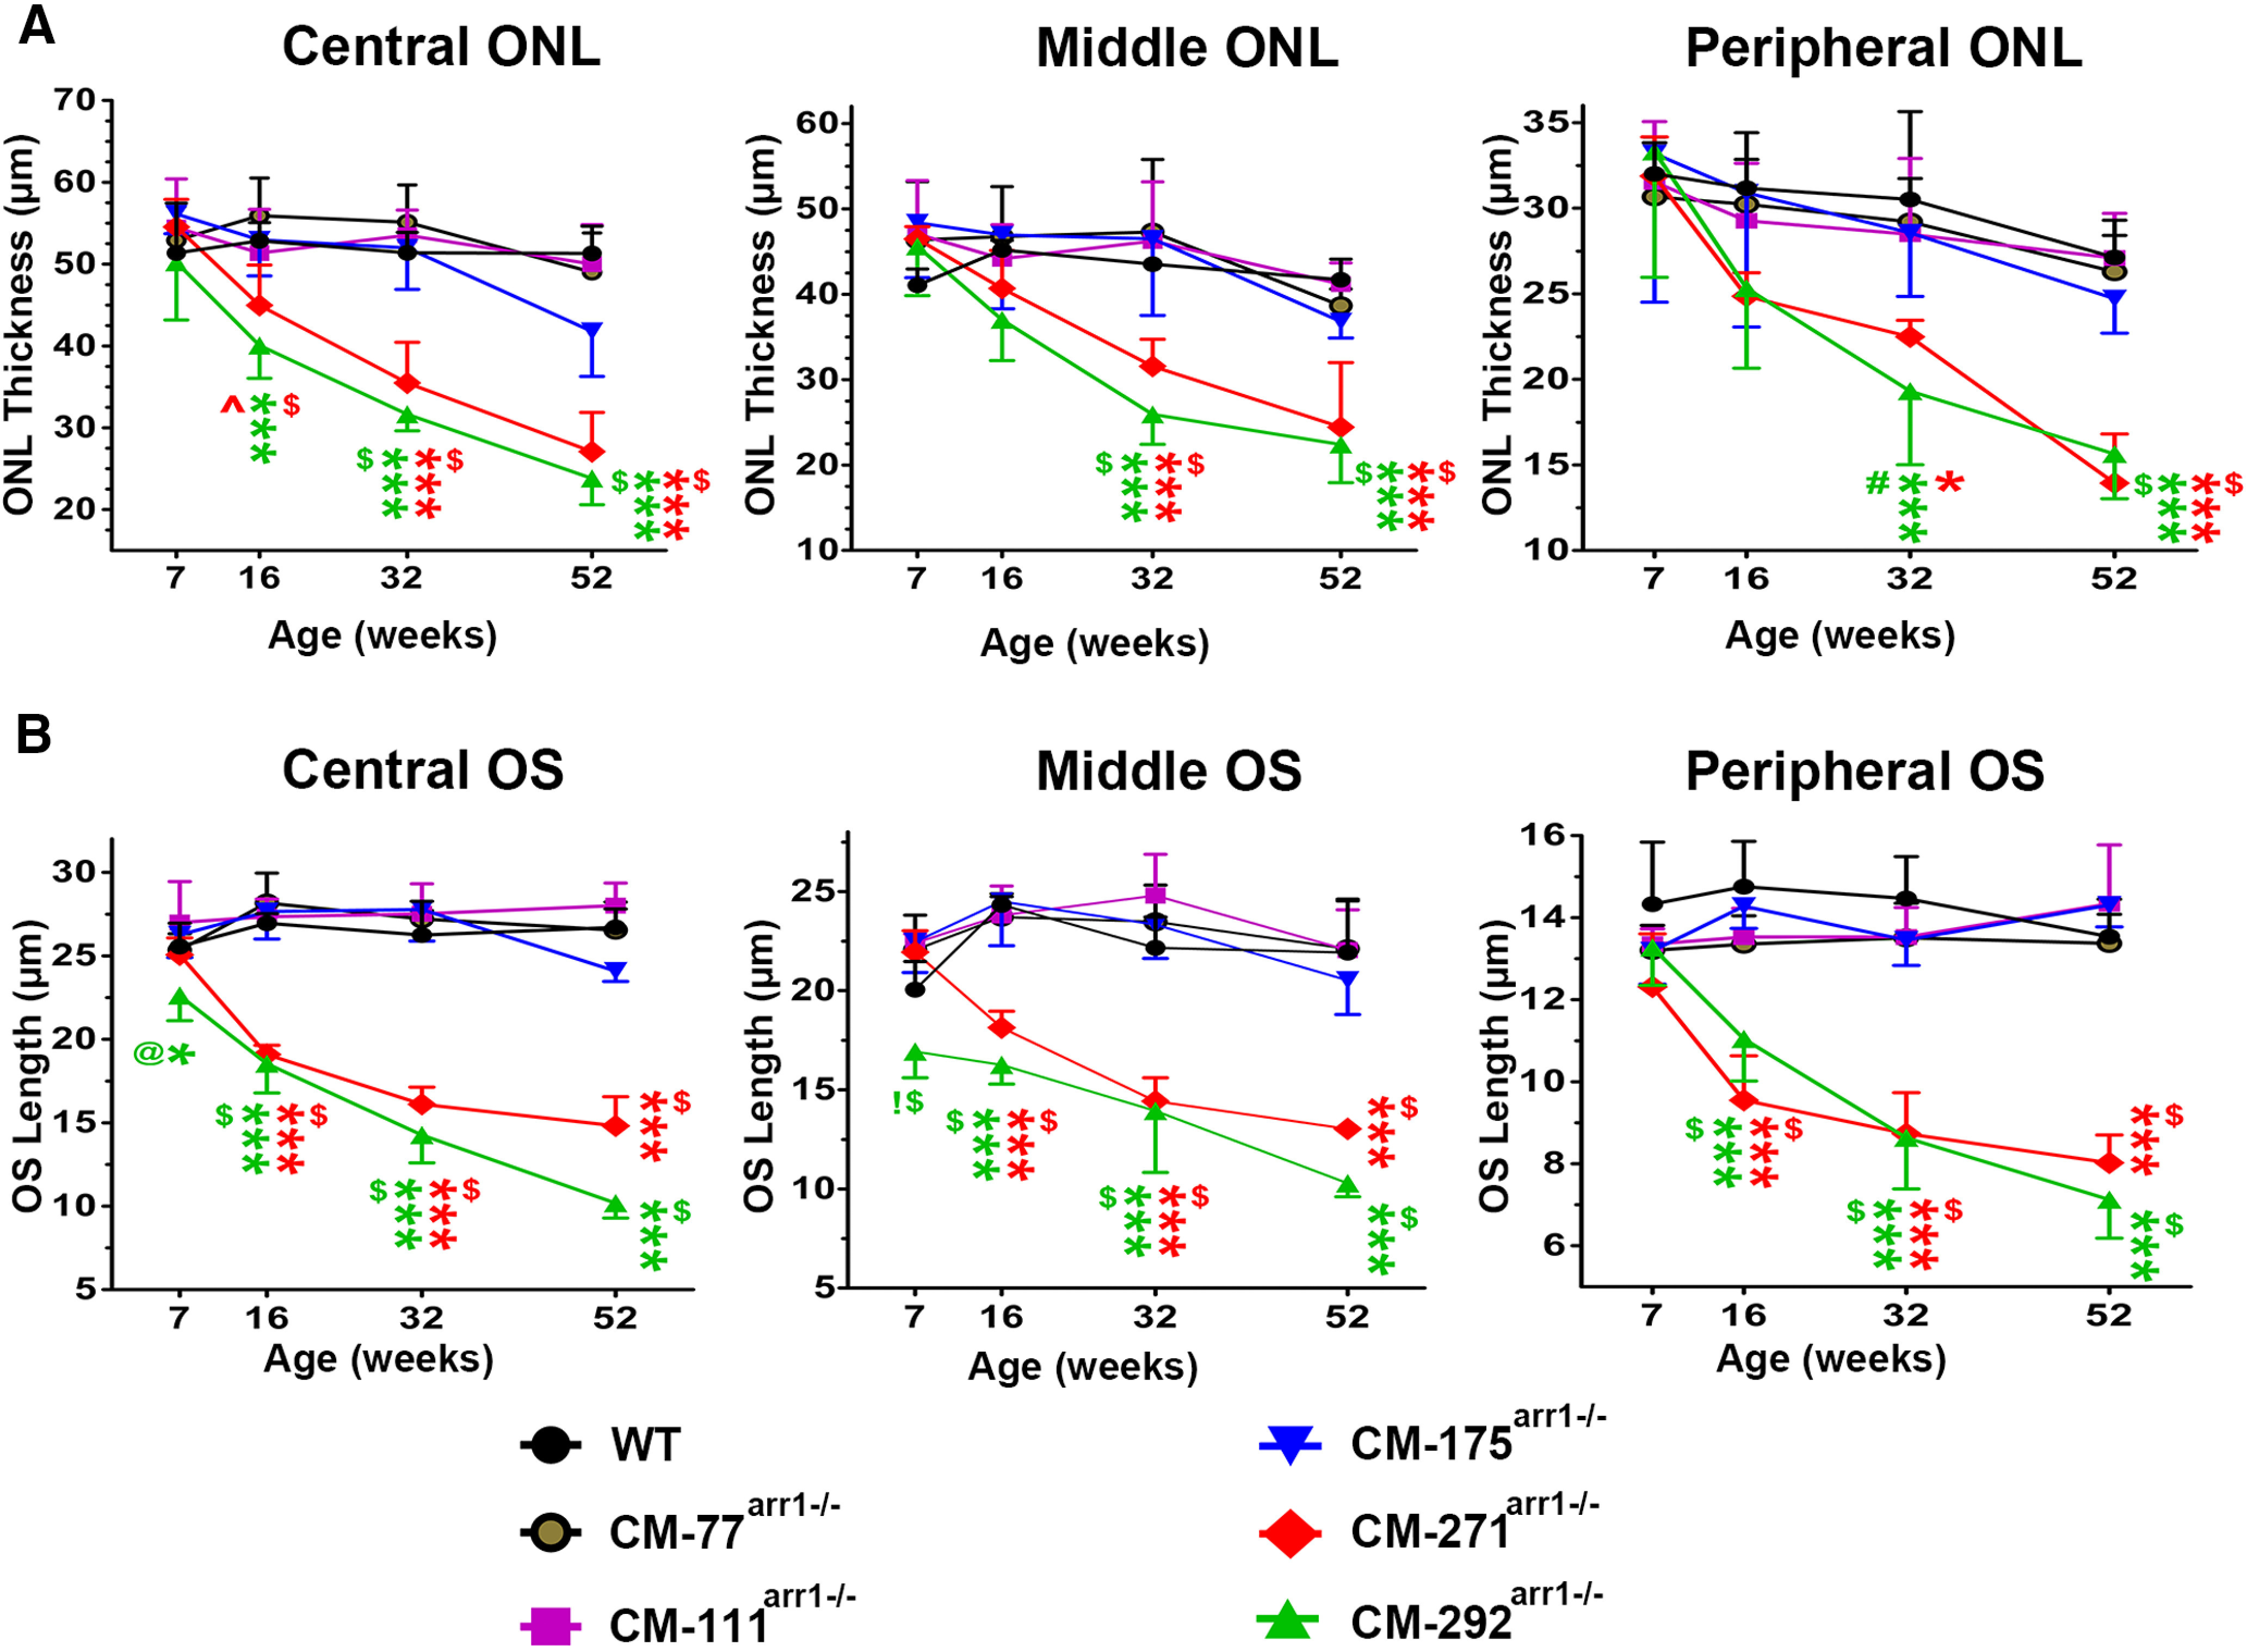
Figure 8.

High expression of CM results in progressive loss of photoreceptor cells. A, The thickness of the ONL in the central, middle, and peripheral retina of mice at indicated ages. Two-way ANOVA with genotype and age as main factors revealed significant effects of genotype in the central (F(5,96) = 51, p < 0.0001), middle (F = 20.5, p < 0.0001), and peripheral (F = 11.77 p < 0.0001) retina. The effect of age was also significant in all retinal subdivisions (p < 0.001). The decline in the ONL thickness with age was more apparent in CM271arr−/− and CM292arr−/− lines, as evidenced by the significant genotype × age interaction (p < 0.0001 for the central and middle retina; p = 0.0012 for the peripheral retina). ***p < 0.001 to WT; $p < 0.001 to CM77arr−/−, CM111arr−/−, and CM175arr−/−; ∧p < 0.01 to CM77arr−/−, according to Bonferroni post hoc comparison for each retinal subdivision and age. The symbols are color coded to refer to CM271arr−/− or CM292arr−/− lines. N = 5 mice/genotype/age. B, The length of the OS in the central, middle, and peripheral retina of mice at indicated ages. Two-way ANOVA with genotype and age as main factors revealed significant effects of genotype in the central (F(5,96) = 224, p < 0.0001), middle (F = 104, p < 0.0001), and peripheral (F = 97 p < 0.0001) retina. The effect of age was significant in all retinal subdivisions (p < 0.0001; as was the genotype × age interaction, p < 0.0001). The statistical significance of the differences is shown, as follows: *p < 0.05, ***p < 0.001 to WT; $p < 0.001 to CM77arr−/−, CM111arr−/−, and CM175arr−/−; #p < 0.01 to CM77arr−/− and CM111arr−/−, and p < 0.05 to CM175arr−/−; @p < 0.01 to CM175arr−/− and CM111arr−/−; !p < 0.001 to CM271arr−/−, according to Bonferroni post hoc comparison following separate one-way ANOVA for each retinal subdivision and age. N = 5 mice/genotype/age. Representative sections showing ONL and OS in different lines are presented in Figures 9 and 10, respectively.
