
Figure 3.
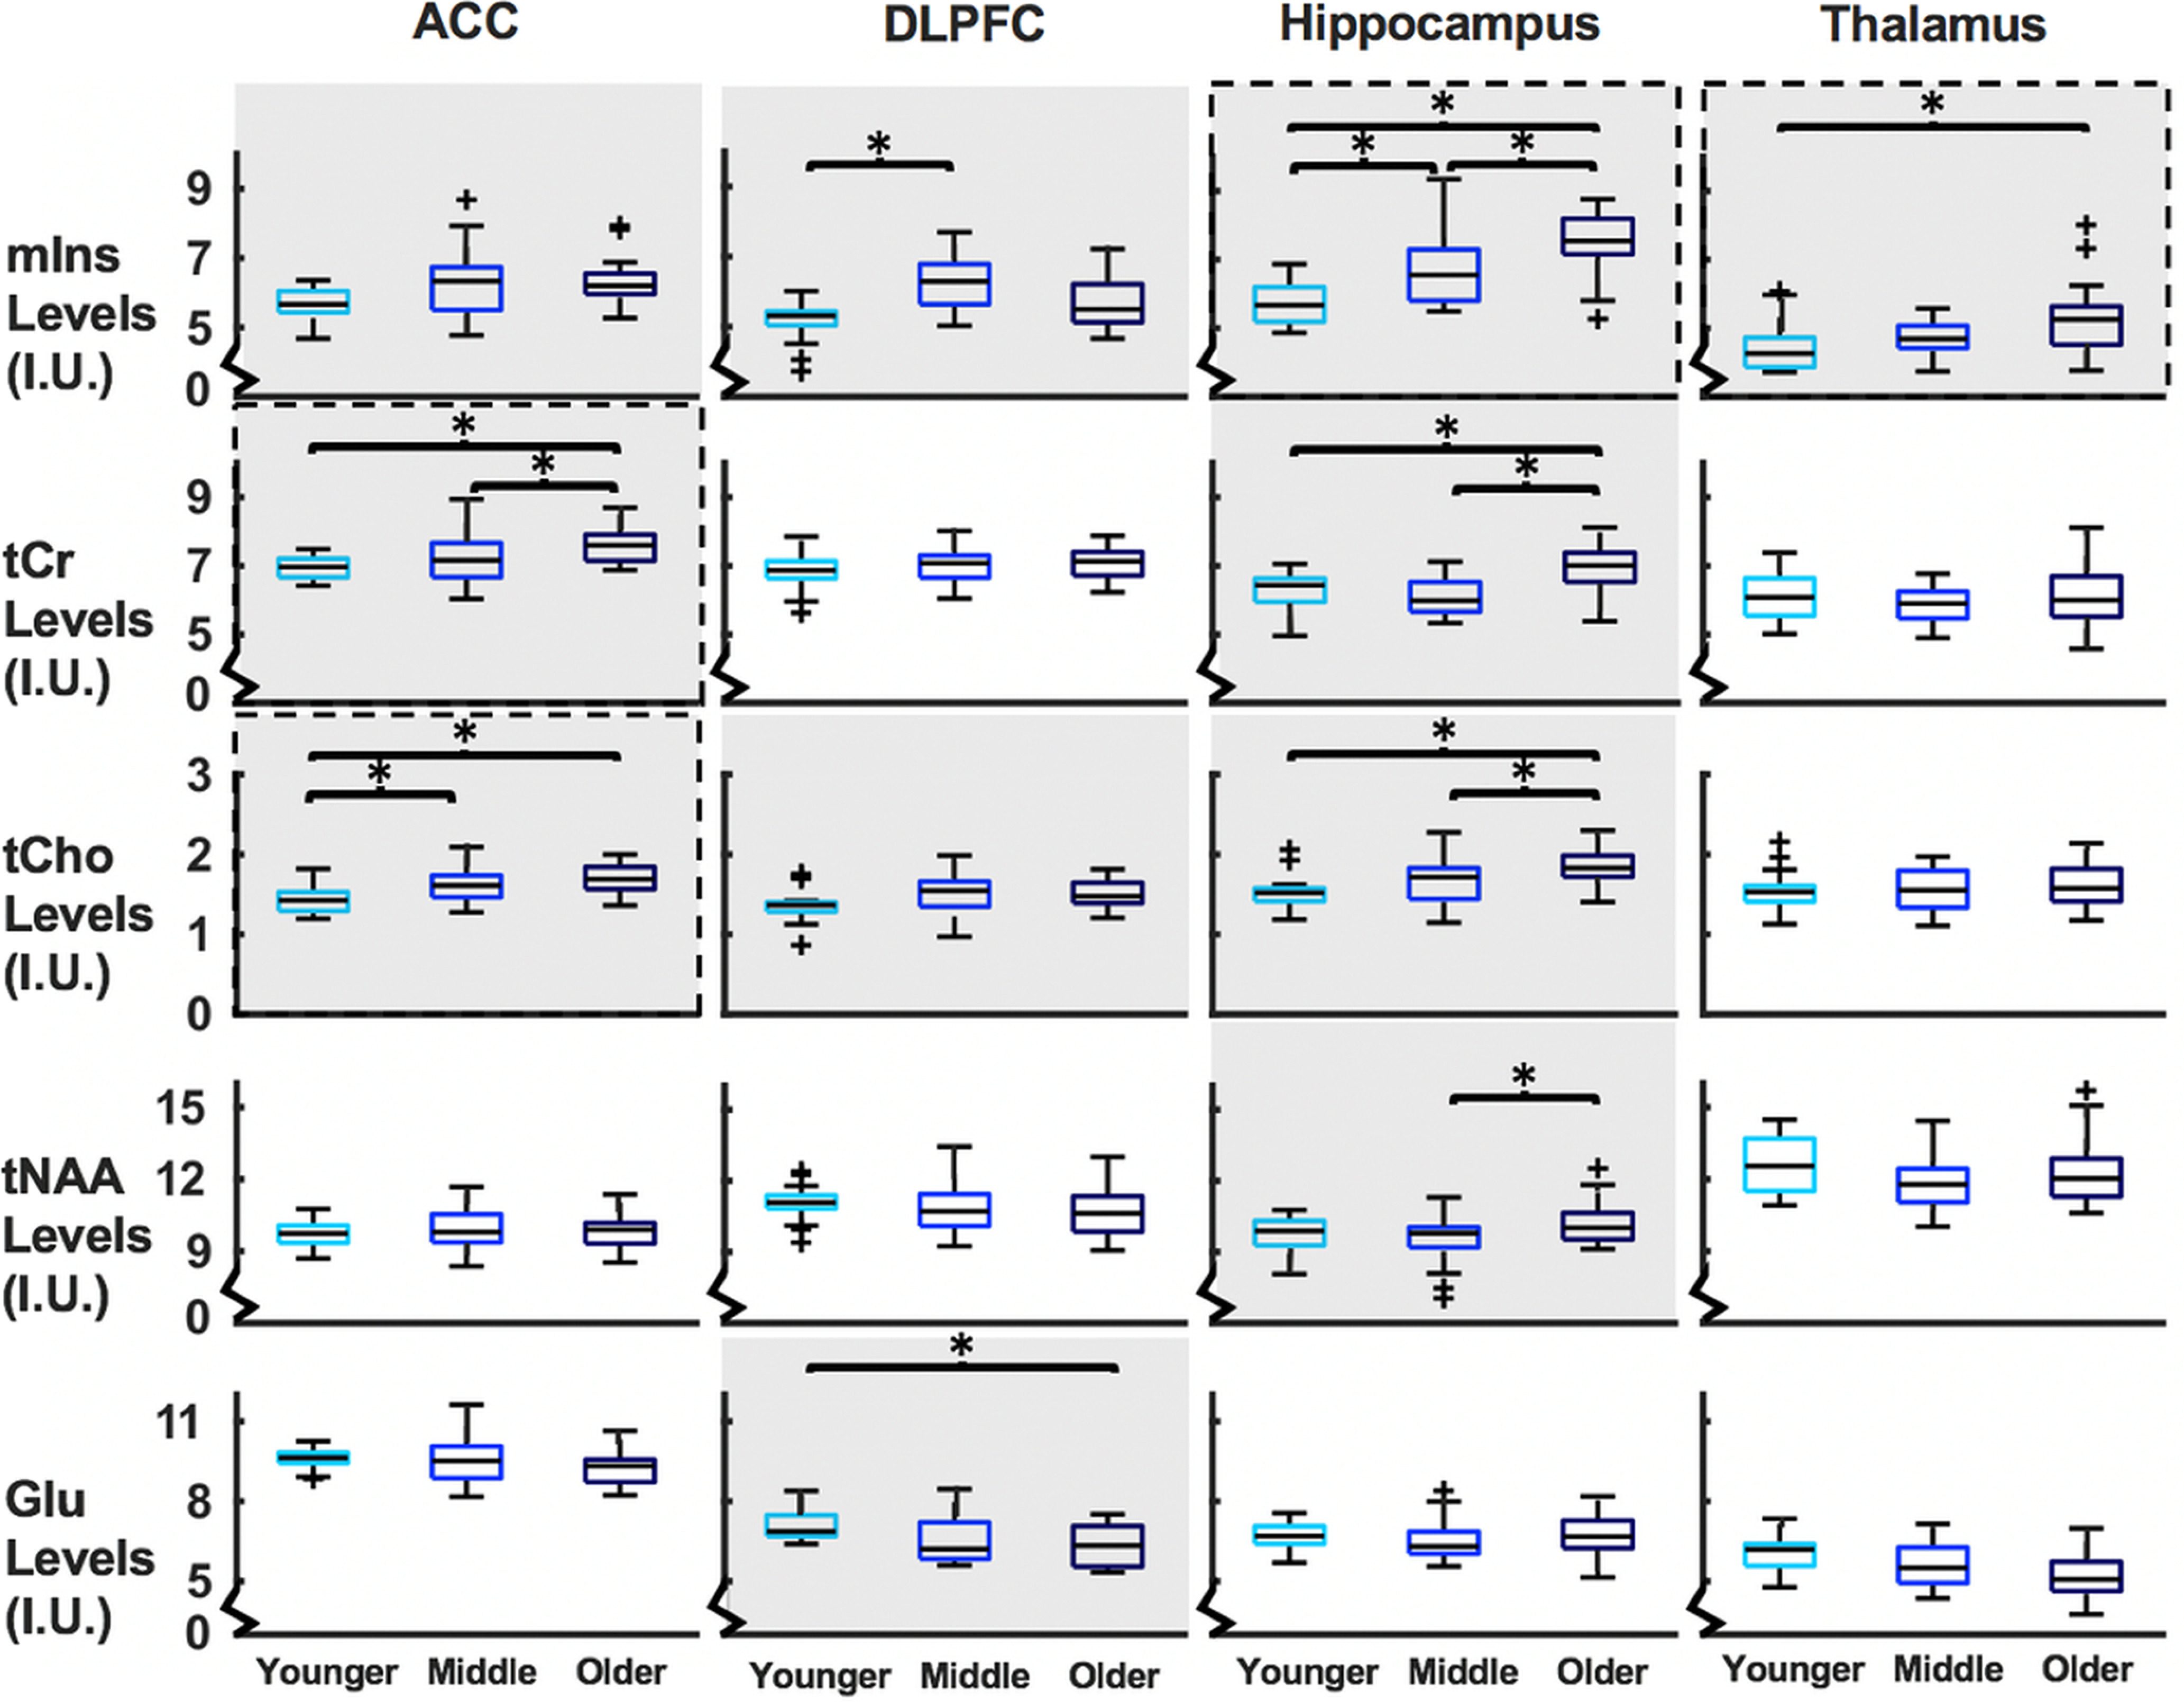
Boxplots of metabolite levels (y axes) separated by region and age group (x axes). Metabolites with a significant main effect of age group at ANCOVA level have a gray background. *Significant pairwise differences between groups. Metabolites that significantly correlate with vsWM score are enclosed in a dashed line. I.U., Institutional units.