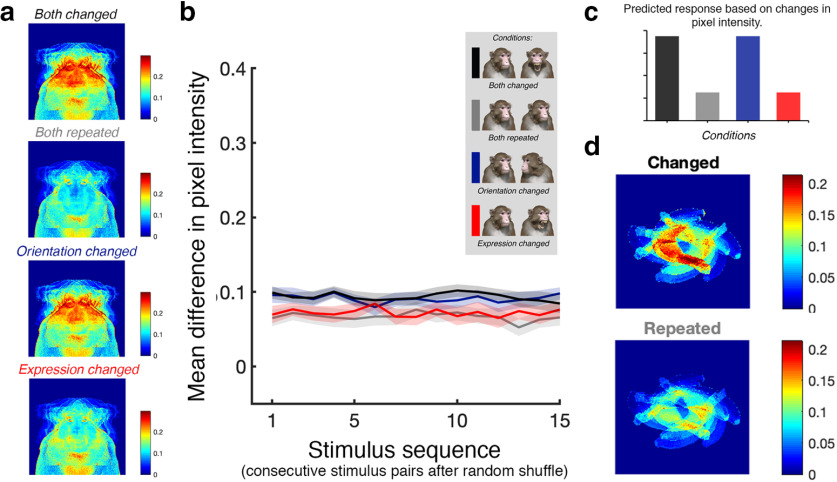
Figure 2.
The impact of image sequence on changes in pixel intensity. a, Mean change in intensity for every pixel across conditions in the main adaptation experiment. Top-to-bottom, Both-changed, both-repeated, orientation-changed, and expression-changed conditions. b, Mean difference in pixel intensity as a function of stimulus pair in a random sequence. Lines represent different adaptation conditions. Black and blue lines, Mean difference in the both-changed and orientation-changed conditions, respectively; gray and red lines, mean difference in the both-repeated and expression-changed conditions, respectively. c, The predicted pattern of activation across adaptation conditions in regions of interest that are sensitive to image change. d, Mean change in intensity for every pixel across conditions in the face specificity adaptation experiment. Top, The banana-changed condition; bottom, the banana-repeated condition.

