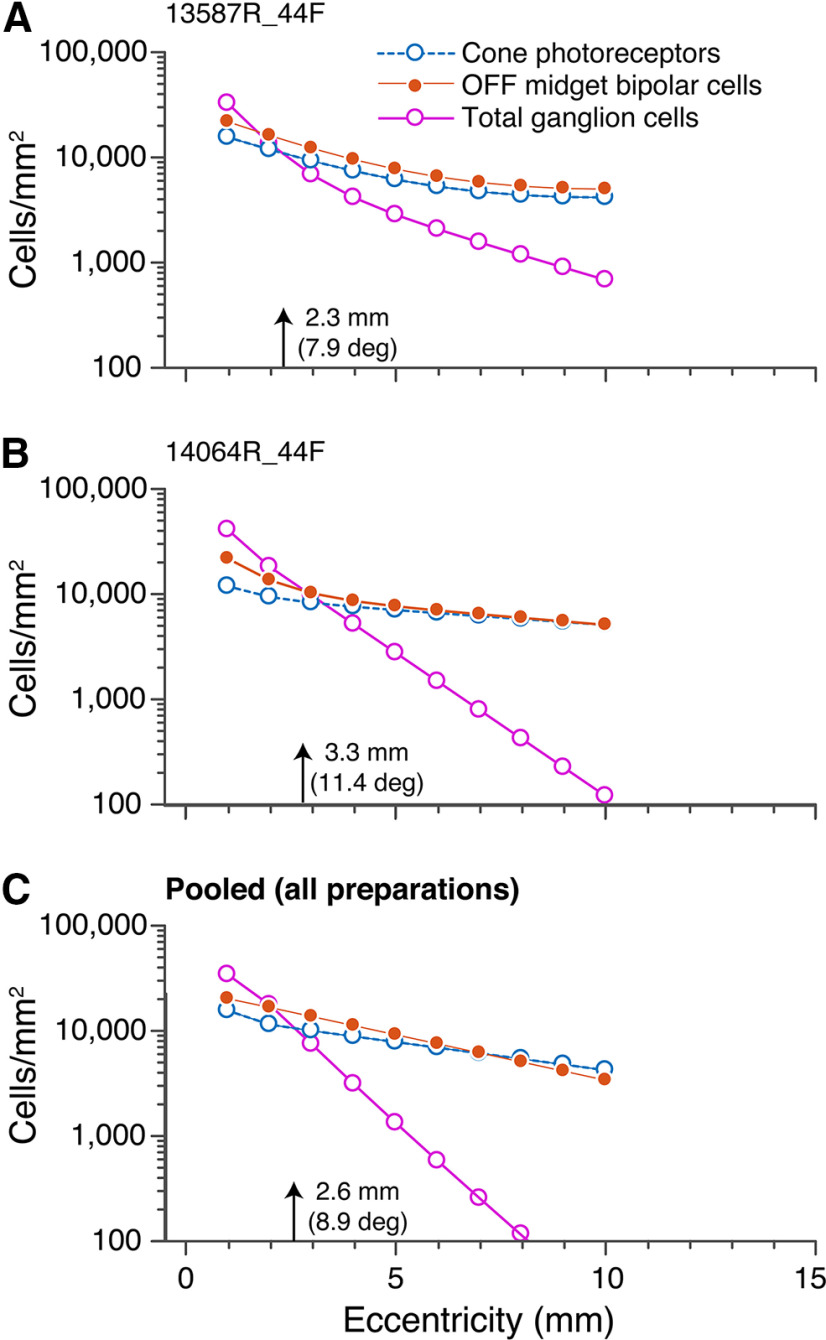
Figure 10.
Density of cone photoreceptors, OFF-midget bipolar cells, and ganglion cells. The average densities of cone photoreceptors (blue), OFF-midget bipolar cells (orange), and ganglion cells (pink) are shown on a logarithmic scale from 1- to 10-mm eccentricity for preparations #13587 (A) and #14064 (B), as well as the average across all preparations (n = 6; C).

