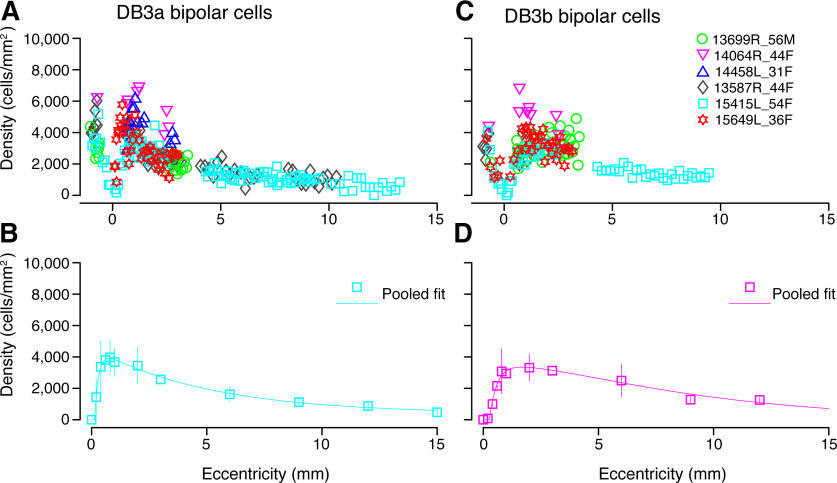
Figure 7.
Spatial density of DB3a and DB3b bipolar cells. A, Density of DB3a cells quantified using antibodies against calbindin in six preparations. B, Data from A fit to a sum of exponents curve to illustrate the spatial density of DB3a cells across temporal retina. C, The density of DB3b cells plotted against eccentricity for five preparations. DB3b cells were identified with antibodies against CD15. D, Pooled data across these five preparations fit to a sum of exponents curve to show the population density of DB3a cells up to 15 mm temporal to the fovea. DB3a and DB3b cells have comparable densities across the retina. Error bars in B, D (in many cases smaller than the marker symbols) show SDs.

