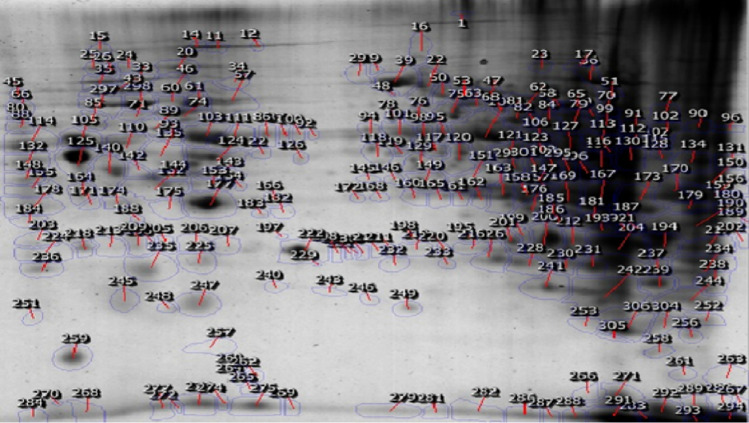
Fig. 4.
Aligned 2DE images of extracted proteins from the control and infected groups at 2 dpi using Progenesis Same-Spots software to detect differentially expressed proteins. Extracted proteins loaded on 7-cm IPG strips (pI 3-10) for the first dimension, and afterwards, SDS-PAGE was carried out as the second dimension. Proteins were stained using the anionic dye Coomassie blue R-350. Protein spots that showed a fold change > 2 were selected

