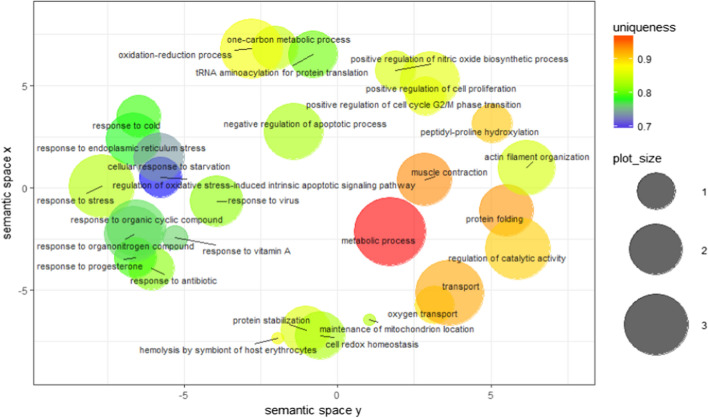
Fig. 6.
Biological processes of 2 dpi samples. Semantic similarity-based scatter-plot of differentially expressed protein spots from kidney samples at 2 dpi. The allowed similarity was adjusted to 0.7, and simRel was selected as the similarity measure. Size indicates the frequency of the GO term in the underlying GOA database (bubbles of more general terms are larger)

