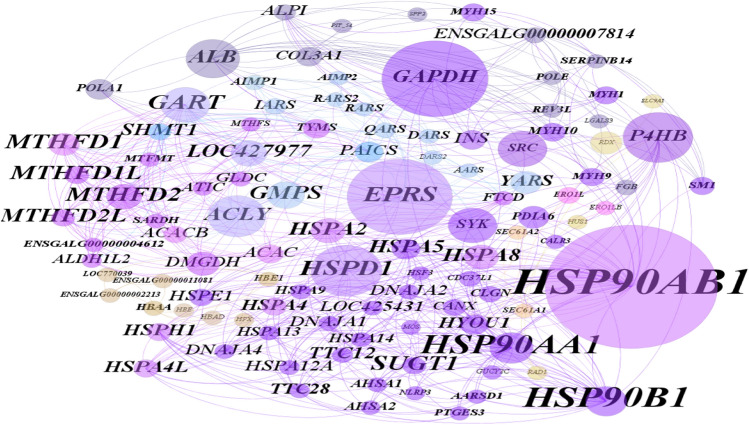
Fig. 8.
Interaction network of differentially expressed proteins at 2 dpi (high confidence < 0.7). The size of the circle shows the importance of the node in relation to its neighbors. Table 2 shows the centralities of important nodes. This is an undirected graph. Differences in the color of circles show that the proteins belong to different components of the graph

