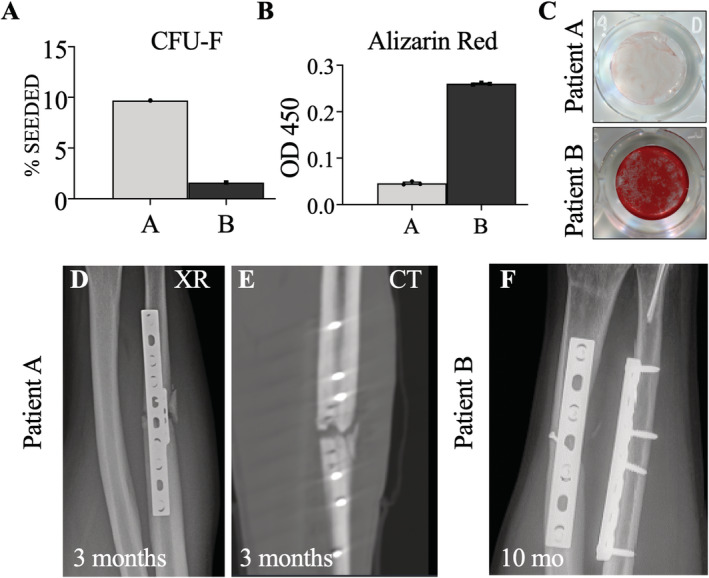
Fig 2.

(A) Comparison of colony forming unit‐fibroblast (CFU‐F) assay between patients A and B as a percent of hSSCs cultured. (B) Alizarin red stain quantification between samples A and B run in triplicate using spectrophotometry with optical density measurement at 450 nm. (C) Qualitative comparison of alizarin red staining of hSSCs after osteogenic differentiation. (D,E) plain radiographs (XR) and computed tomography (CT) at 3months demonstrating absence of callus formation in patient A (F). Ten month radiographs of patient B demonstrating healed fractures.
