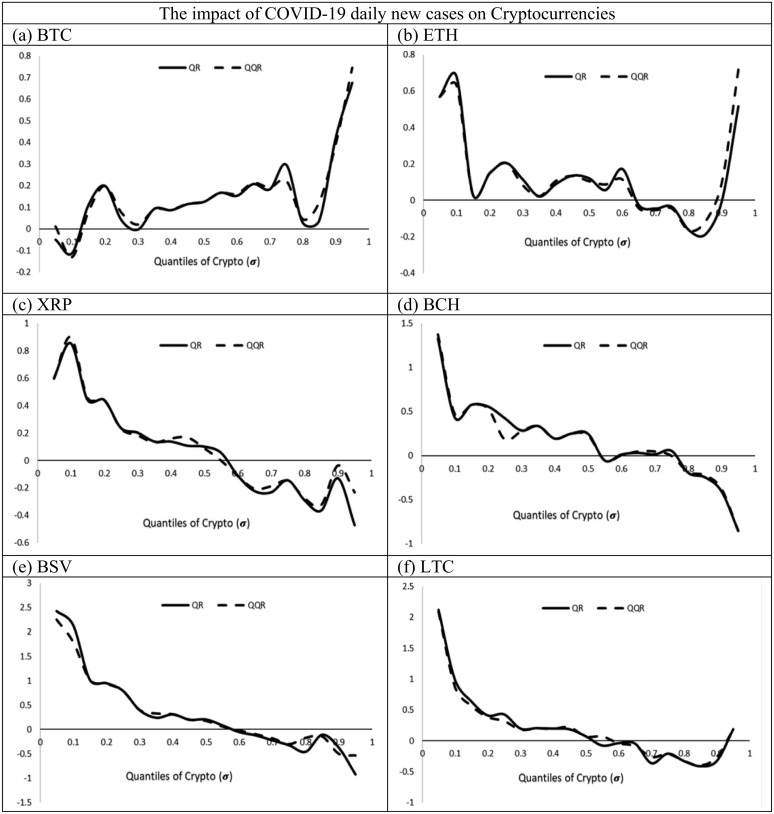
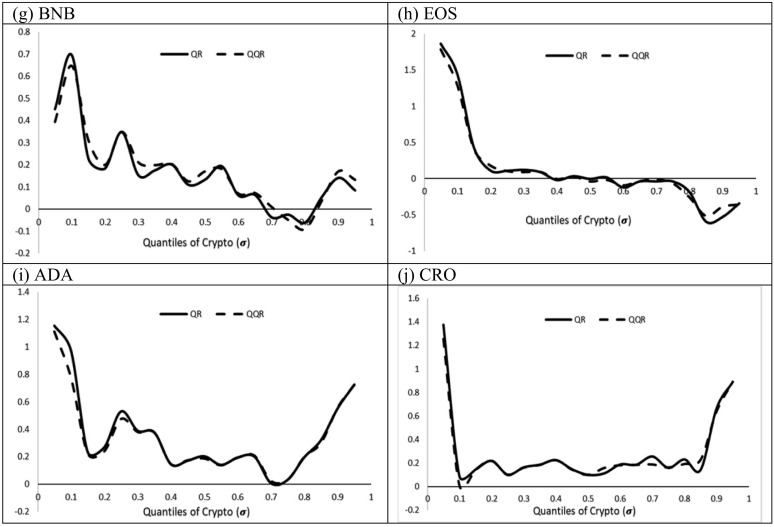
Fig. 5.
Comparison between estimated coefficients of QQR & QR Note: These graphs indicate the validity of QQR estimates through comparing the slope of the coefficients from standard quantile regression and the averaged quantile on quantile regression. The plain lines show the QR coefficients while the dotted lines indicate the QQR coefficients. In each graph, the x-axis shows the quantiles (0.5–0.95) while the y-axis shows the coefficients of Cryptot, estimated from QR & QQR. The selected cryptocurrencies are Bitcoin (BTC), Ethereum (ETH), XRP, Bitcoin Cash (BCH), Bitcoin SV (BSV), Litecoin (LTC), Binance Coin (BNB), EOS, Cardano (ADA) and Tezos (XTZ).


