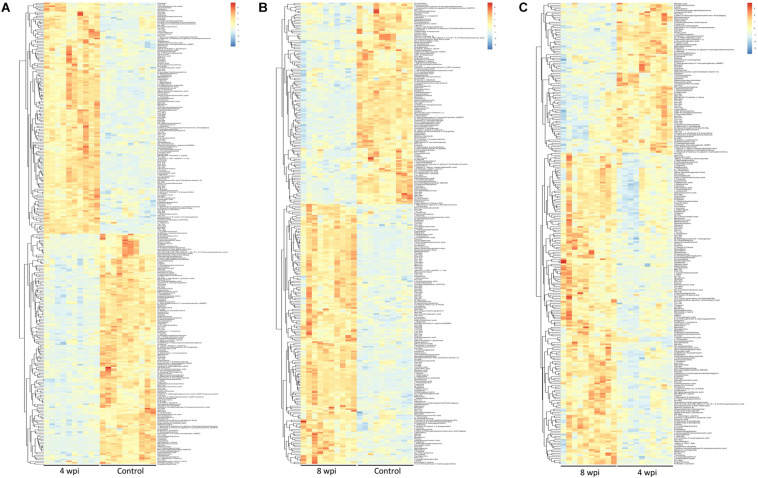
FIGURE 4.
Heatmaps representation of the differential metabolites identified between different infection group vs control group in ESI+ mode. (A) 4 wpi vs control; (B) 8 wpi vs control; (C) 8 vs 4 wpi. The color blocks at different positions represent the relative expression of metabolites at corresponding positions, red represents up-regulated, and blue represents down-regulated.

