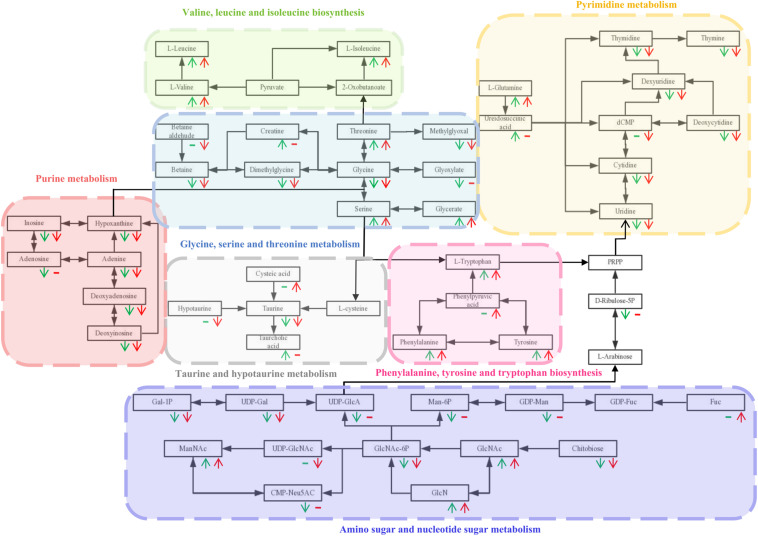
FIGURE 8.
The integrated metabolic pathway shared in 4 and 8 wpi during C. sinensis infection. Beneath each metabolite, green and red represent 4 and 8 wpi compared with the control, respectively. The arrows indicate up and down-regulation of metabolites, respectively. Horizontal lines indicate that the metabolites are not significantly different in this infection stage.

