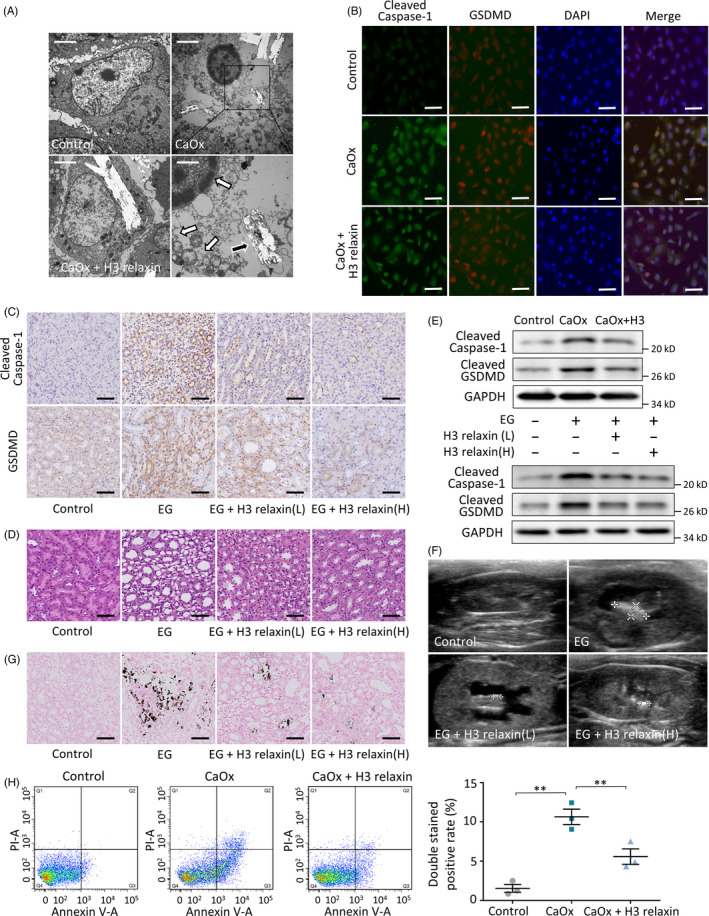
FIGURE 2.

H3 relaxin improves the CaOx crystal‐related inflammatory pyroptosis in vivo/in vitro. A, tubular epithelial cells (TECs) were stimulated with CaOx crystals (0.5 mmol/L, 24 h) with or without H3 relaxin pretreated (20 ng/mL). Transmission electron microscopy (TEM) showed that swelling cell took up crystals (black arrow), pyknotic nuclei with chromatin margination (white arrow), vacuoles formed then spilled out (white arrows), whereas H3 relaxin treatment inhibited this performance. Scale bars: 10 μm (left, upper right); 3 μm (bottom right). B, The protein expression of cleaved caspase‐1 and cleaved gasdermin D was detected using immunofluorescence assays in the treated TECs in groups. Scale bars: 100 μm. C, The expression of same proteins was detected using immunohistochemical assays in kidneys of rats fed normal or ethylene glycol and NH4Cl added drink for 14 d, with or without H3 relaxin treated. Scale bars: 50 μm. D, Haematoxylin and eosin staining showed tubular dilatation; neutrophil infiltration; and epithelial cell deformation and exfoliation after 14 d of treatments. H3 relaxin improved these in a dose‐dependent manner. Scale bars: 50 μm. E, Western blot analysis of indicated proteins in the treated TECs or rats kidney samples (14 d), in the absence or presence of H3 relaxin. n = 3 per group, representative images are shown. F, Ultrasonographic examination showed CaOx crystal formation, hydronephrosis and renal cortex thinning in rats after 14 days replaced drinking, whereas H3 relaxin treatment inhibited this performance. G, Von Kossa staining also demonstrated obviously crystal deposition after 14 d of treatments, which were improved by H3 relaxin injection. n ≥ 3 per group, representative images are shown. H, Cell death detection of TECs after different treatments. n = 3, Data expressed as means ± SEM. *P < .05, **P < .01
