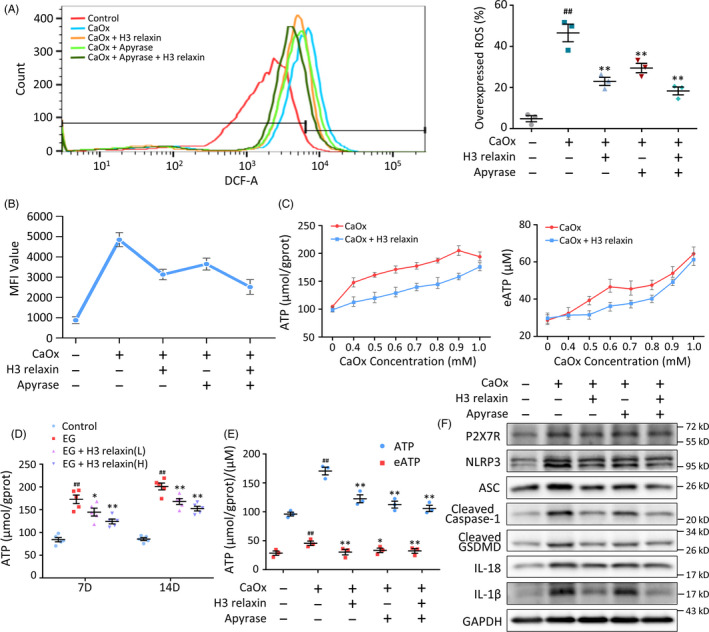
FIGURE 5.

H3 relaxin relieves the CaOx crystal‐induced cell damage by regulating the extracellular ATP levels. A, Reactive oxygen species (ROS) analysis of the treated tubular epithelial cells (TECs) with or without the pretreatment of H3 relaxin and apyrase. n = 3, data expressed as means ± SEM, ## P < .01 vs control group, *P < .05 vs CaOx group, **P < .01 vs CaOx group. B, Mean fluorescence intensity of the ROS detected TECs, as a supplement to the overexpressed ROS percentage. n = 3, data expressed as means ± SEM, P < .05, comparison principles unchanged. C, TECs were stimulated with increasing dose of CaOx crystals with or without H3 relaxin pretreatment. Intracellular ATP and eATP levels were measured using colorimetric ATP assay. n = 3, data expressed as means ± SEM, P < .05 control vs each point in CaOx group, P < .05 CaOx + H3 relaxin group vs CaOx group. D, ATP levels in renal tissue extracts of the treated rats (7, 14 d) were detected using colorimetric ATP assay. n = 5, data expressed as means ± SEM, ## P < .01 vs control group, *P < .05 vs ethylene glycol (EG) group, **P < .01 vs EG group. E, Intracellular ATP and eATP levels in the treated TECs in the absence or presence of H3 relaxin and apyrase. n = 3, data expressed as means ± SEM, ## P < .01 vs control group, *P < .05 vs CaOx group, **P < .01 vs CaOx group. F, Western blot analysis of P2X7R and inflammatory pyroptosis‐related proteins in the treated TECs, in the absence or presence of H3 relaxin and apyrase
