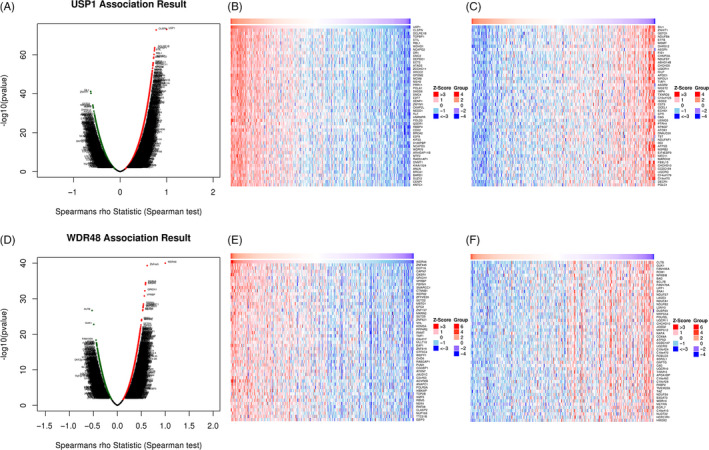
Figure 7.

Differentially expressed genes that correlated with USP1 or WDR48 in HCC. A, Correlations between USP1 and differently expressed genes (Spearman correlation analysis). B‐C, Heat maps show the genes that are positively or negatively correlated with USP1 (Top 50 genes are shown). D, Correlations between WDR48 and differently expressed genes (Spearman correlation analysis). E‐F, Heat maps show the genes that are positively or negatively correlated with WDR48 (Top 50 genes are shown)
