
Figure 9.
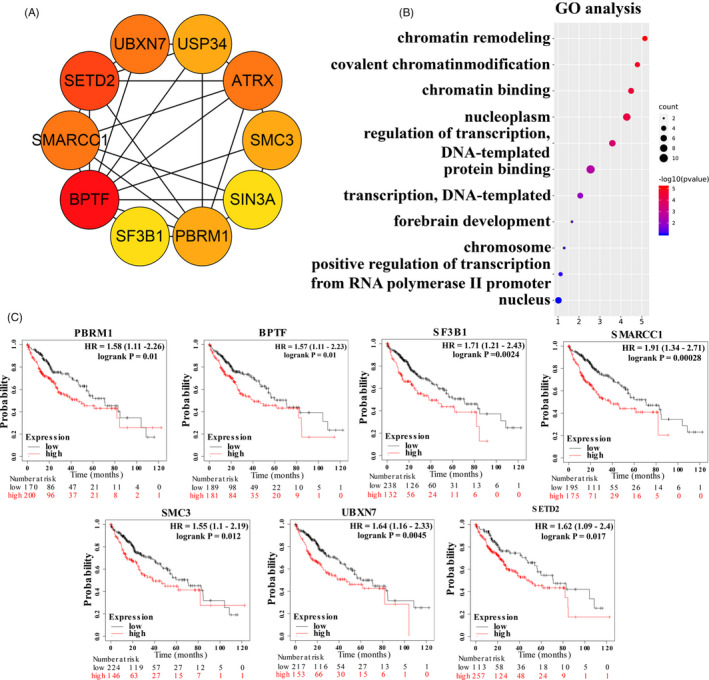
Hub gene analysis. A, The interaction network of the top 10 hub genes. B, GO analysis of the top 10 hub genes. C, The prognostic values of seven hub genes (BPTF, SETD2, SMARCC1, UBXN7, SMC3, PBRM1 and SF3B1)
Official websites use .gov
A
.gov website belongs to an official
government organization in the United States.
Secure .gov websites use HTTPS
A lock (
) or https:// means you've safely
connected to the .gov website. Share sensitive
information only on official, secure websites.
Hub gene analysis. A, The interaction network of the top 10 hub genes. B, GO analysis of the top 10 hub genes. C, The prognostic values of seven hub genes (BPTF, SETD2, SMARCC1, UBXN7, SMC3, PBRM1 and SF3B1)