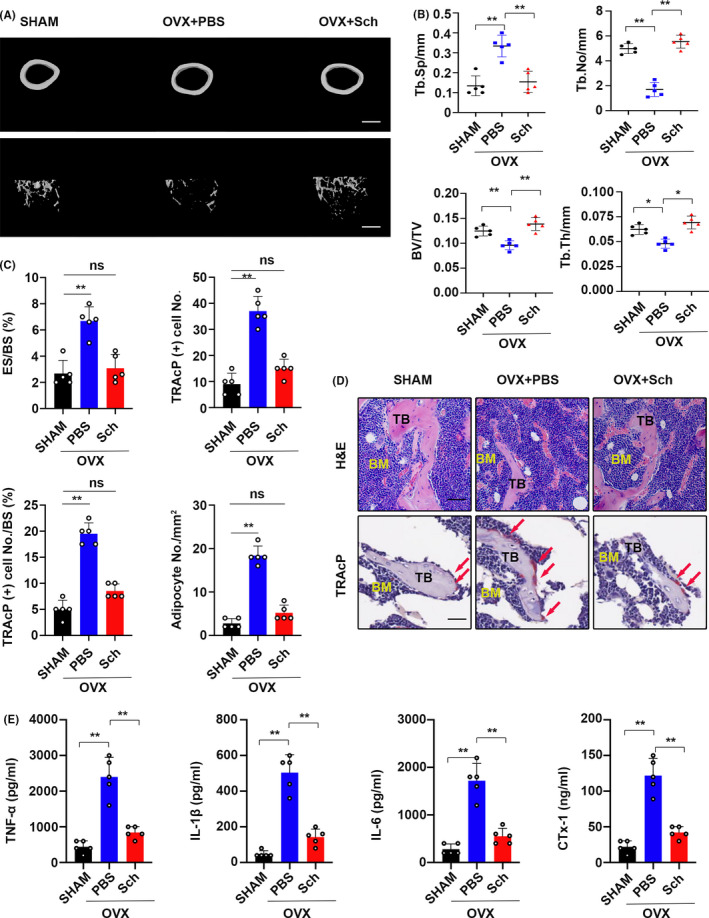
FIGURE 1.

Sch reduced OVX‐induced bone loss in vivo. A, Representative micro‐CT of trabecular (Tb) and cortical (Ct) bone from each group (n = 5 per group). Scale bar = 500 μm. B, Quantification of trabecular separation (Tb.Sp), trabecular number (Tb.N), bone volume/tissue volume (BV/TV) and trabecular thickness (Tb.Th). C, Quantitative analysis of the eroded surface/bone surface (ES/BS), TRAP‐positive cell numbers from five different versions, TRAP‐positive cell number/bone surface and the adipocyte number per field. D, H&E staining was performed to test the bone loss; TRAcP staining was used to detect OCs. Scale bar = 20 μm. TB, trabecular bone; BM, bone marrow; osteoclasts are indicated by red arrows. E, Serum levels of TNF‐a, IL‐1β, IL‐6 and C‐telopeptide 1 (CTx‐1) in mice from each group were determined by ELISA. The data are shown as means ± SD (n = 5). ns, no significance. *P < .05, **P < .01
