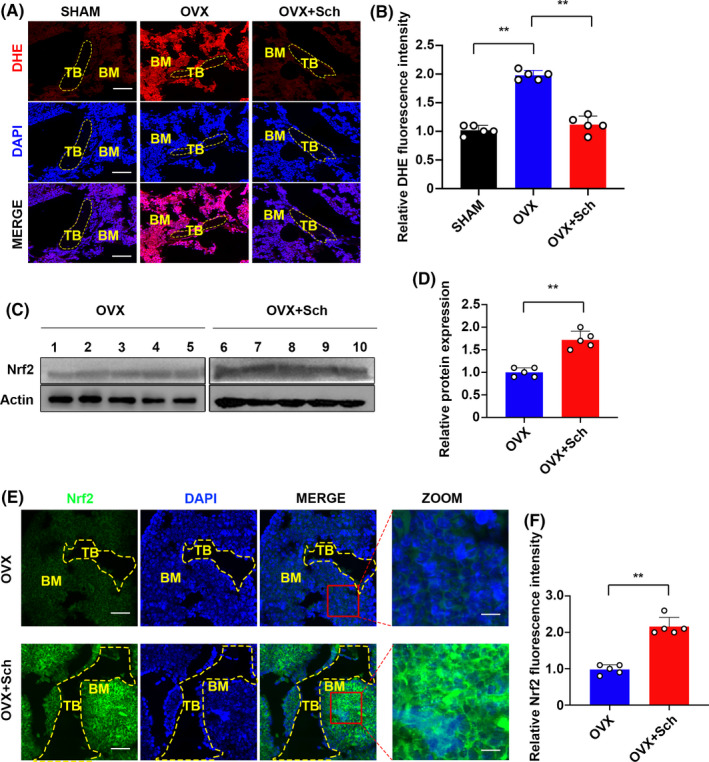
FIGURE 2.

Sch reduced ROS production and enhanced the expression of Nrf2 in vivo. A, Representative images of bone cryosections showing DHE fluorescence in different groups. Scale bar = 200 μm. DHE, dihydroethidium, B, Quantification of DHE fluorescence intensity of each group (n = 5 per group). C, Proteins were isolated from bones from each group, and Nrf2 expression was investigated using Western blotting. OVX + PBS group (1,2,3,4,5) and the OVX + Sch group (6,7,8,9,10). Nrf2: Nuclear factor erythroid 2‐related factor 2. D, Quantification of Western blotting bands. The data are shown as means ± SD (n = 5). E, Immunofluorescence staining was performed to detect the expression of Nrf2. Scale bar = 200 μm. Nuclear translocations of Nrf2 were observed in the zoom pictures. Scale bar = 100 μm. F, Quantitative analysis of Nrf2 immunofluorescence intensity. TB, trabecular bone; BM, bone marrow; DAPI, 4,6‐diamidino‐2‐phenylindole; DHE, dihydroethidium; ROS, reactive oxygen species; Nrf2: nuclear factor erythroid 2‐related factor 2. The data are shown as means ± SD (n = 5). ns, no significance. *P < .05, **P < .01
