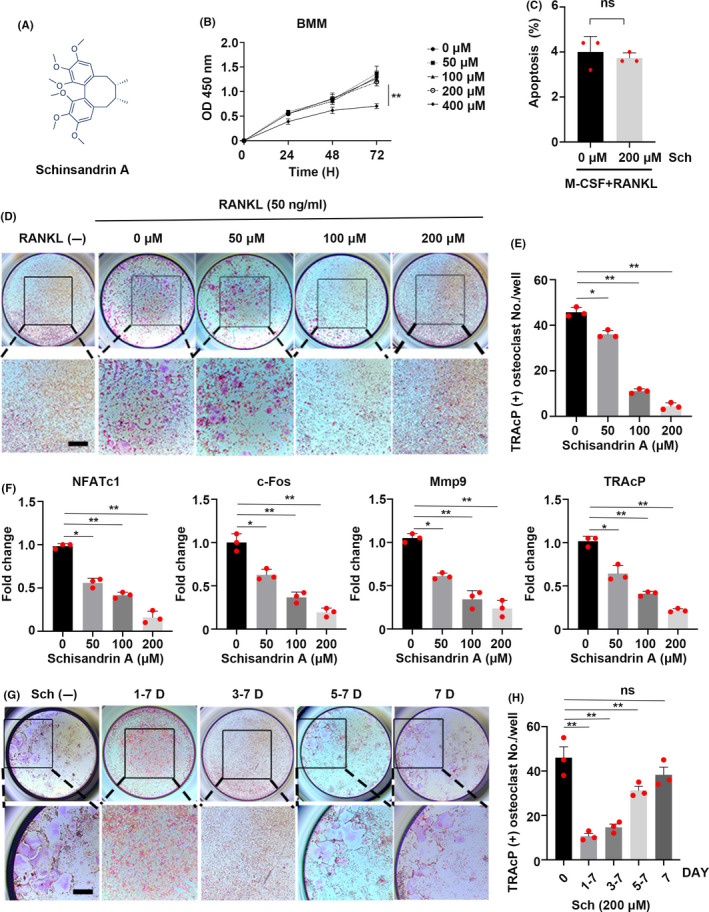
FIGURE 3.

Sch suppresses RANKL‐induced osteoclastogenesis in vitro. A, The chemical structure of schisandrin A. B, Effects of Sch on BMM viability measured by CCK‐8 assay (n = 3 per group). C, Frequency of apoptotic cells of BMMs co‐cultured with 20 ng/mL M‐CSF and 50 ng/mL RANKL at the concentration of 200 μmol/L Sch for 2 d (n = 3 per group). D, Representative images of TRAcP staining showing that Sch inhibited osteoclastogenesis dose‐dependently. BMMs were stimulated with M‐CSF and RANKL in the absence or presence of different concentrations of Sch. E, Quantification of TRAcP‐positive cells per well. The data are shown as means ± SD (n = 3). BMMs, bone marrow‐derived macrophage cells. F, Quantitative qRT‐PCR of osteoclast‐specific genes including NFATc1, c‐Fos, MMP9 and TRAcP were examined in the absence or presence of different concentrations of Sch. G, Representative images of TRAcP staining showed BMMs treated with Sch 200 μmol/L for the indicated days during osteoclastogenesis. H, Quantification of TRAcP‐positive cells per well when treated with Sch in different periods (n = 3 per group). The data are shown as means ± SD. ns, no significance. *P < .05, **P < .01. Scale bar = 200 μm
