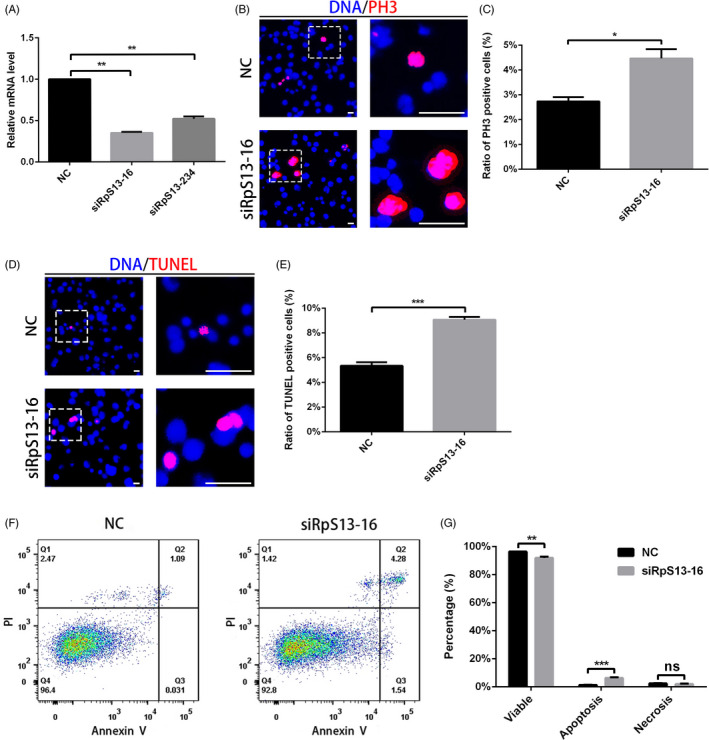
Figure 2.

RpS13 controls proliferation and cell death in S2 cells. A, Relative mRNA level of RpS13 in NC and RpS13 siRNA S2 cells. B, Immunostaining of PH3 (red) in NC and RpS13 siRNA S2 cells. C, Ratio of PH3‐positive cells in NC and RpS13 siRNA S2 cells. D, Staining of TUNEL (red) in NC and RpS13 siRNA S2 cells. E, Ratio of TUNEL‐positive cells in NC and RpS13 siRNA S2 cells. F, Flow cytometry test for PI and Annexin V in NC and RpS13 siRNA S2 cells. G, Cell component analysis in NC and RpS13 siRNA S2 cells. *P < .05, **P < .01, ***P < .001, ns represents no significance. Scale bars, 30 μm
